How to Use Google Trends?



Google Trends is free, instant and used by almost every e-commerce operator at some point. It is also misread more consistently than any other research tool. So how do you actually use it?
Start with what the numbers mean, because this single misunderstanding invalidates most of what people conclude from it.
Google Trends shows relative interest, not search volume. A score of 100 does not mean a million searches. It means that term’s peak within the period and region you selected.
Two products can both show 100 while one gets fifty thousand monthly searches and the other gets four hundred.
That distinction changes how you use the tool entirely.
Four things it does genuinely well.
Seasonality. Pull five years of data and you see exactly when demand rises and falls, which tells you when to launch rather than whether to launch.
Direction over time. A term climbing steadily across eighteen months signals something a snapshot cannot.
Geographic distribution. Interest by country, state or city, which shapes where you advertise.
Comparison between terms. Up to five at once, which is where the relative scoring actually becomes useful.
And one thing it cannot do, which matters more than any of the above.
Google Trends shows interest. It does not show sales. People search for products they never buy, and search volume rising tells you nothing about whether anyone is converting, what margins look like, or who is already advertising against it.
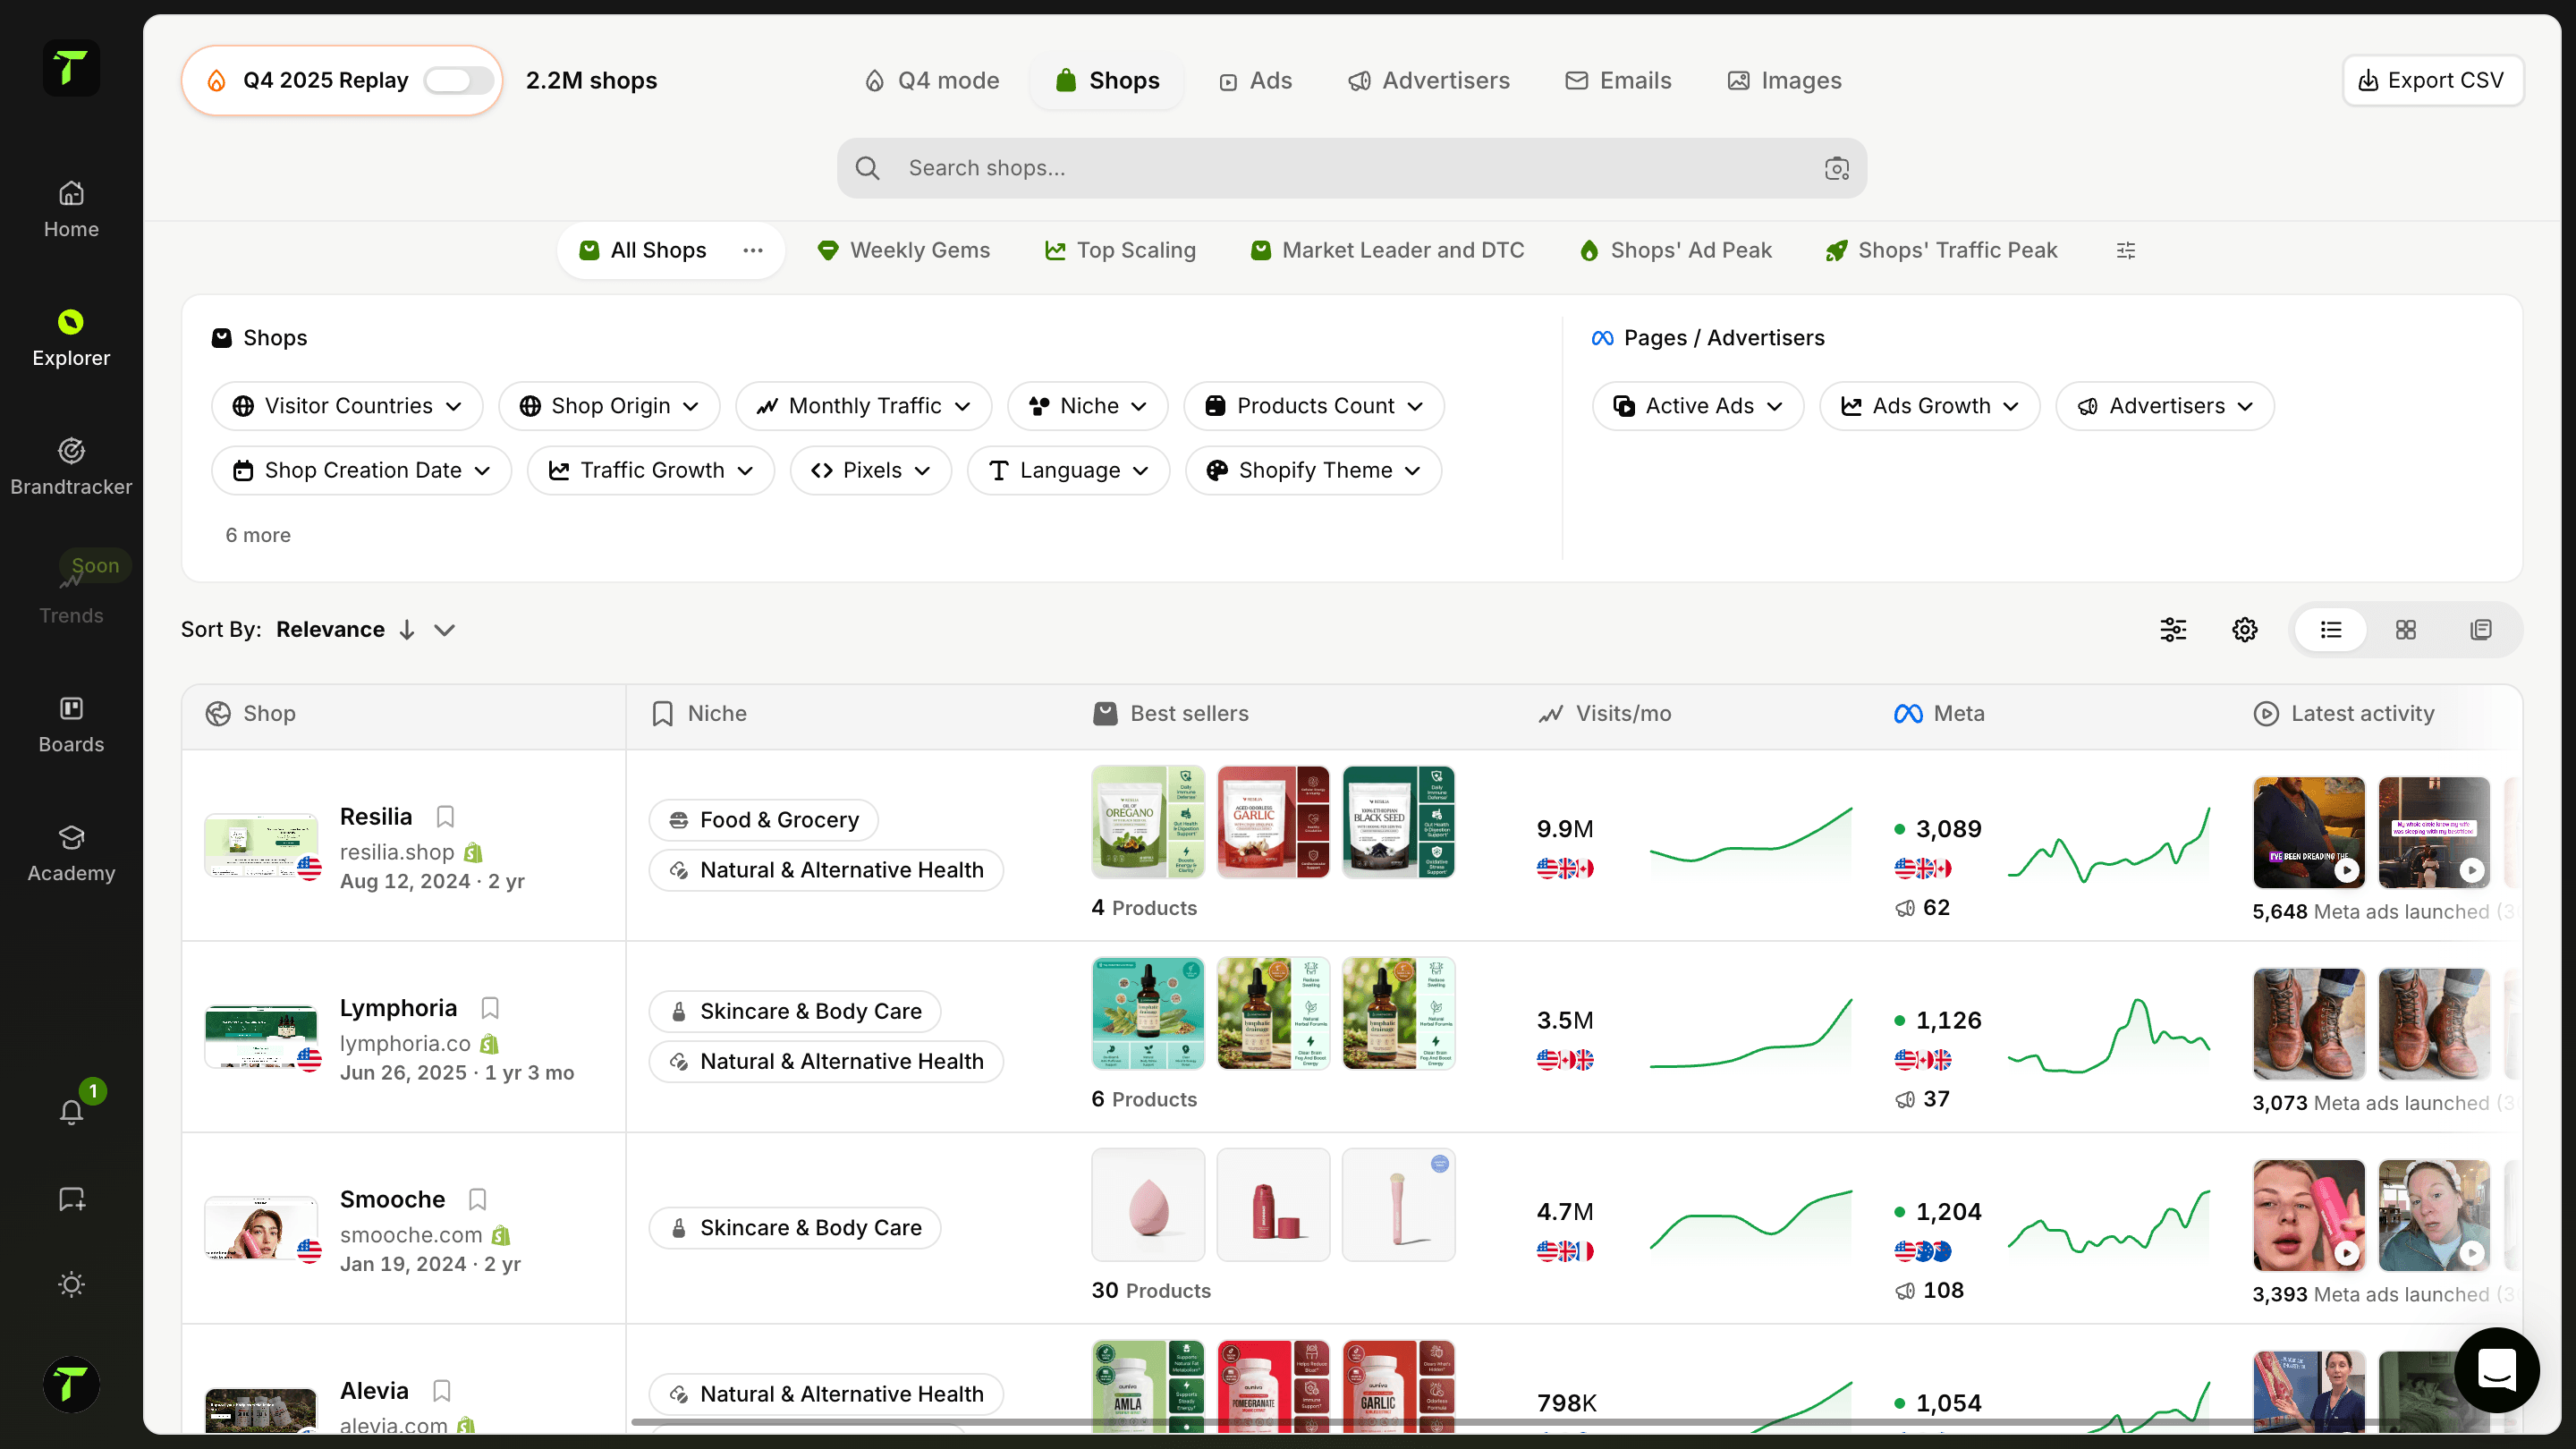
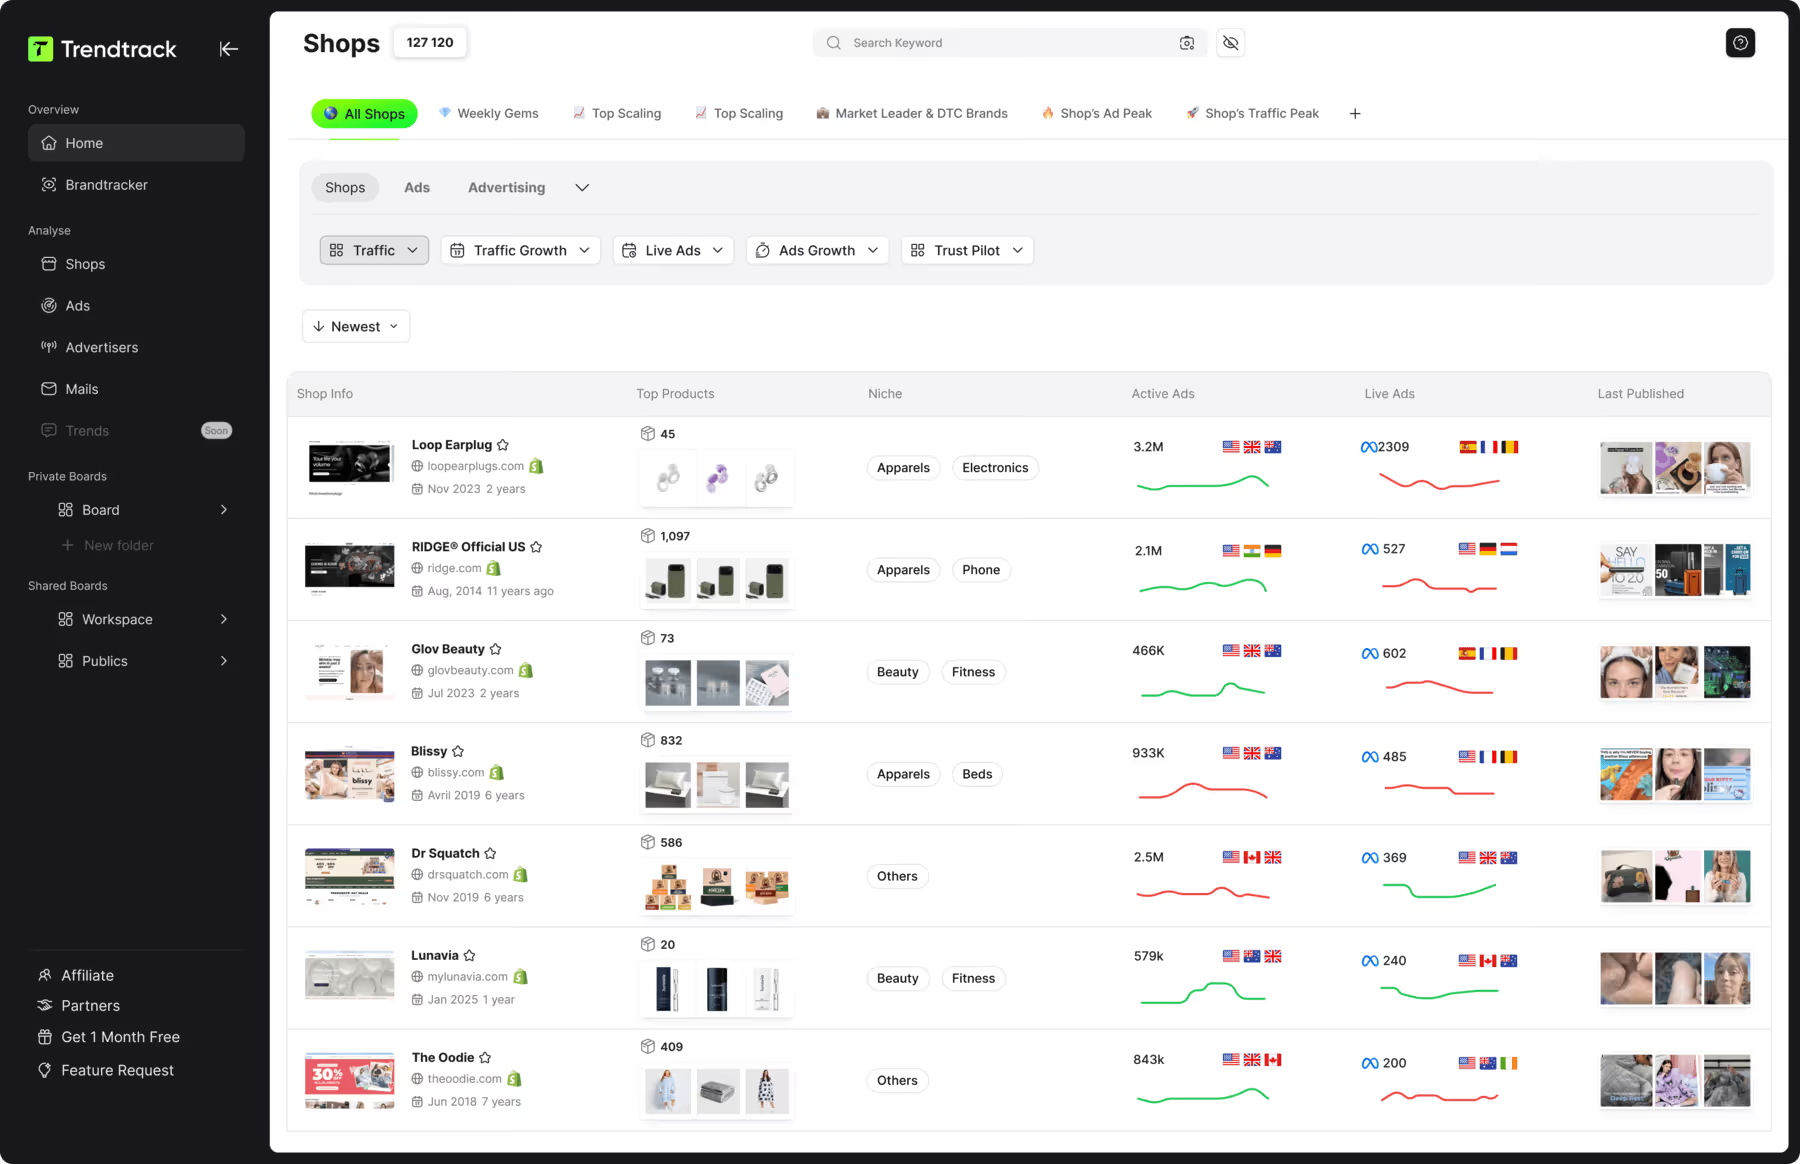
At Trendtrack available at app.trendtrack.io/en/sign-up, we index 95 million TikToks, preserve full ad history across Meta, TikTok and Google, and refresh 700,000+ brand profiles every 24 hours.
In this article we walk through how to use Google Trends properly.
What Google Trends Actually Measures?
Understanding the data prevents the conclusions most people draw from it incorrectly. Here is what the tool reports.
Relative interest, scored from 0 to 100 within your selection
A normalized index, not raw search counts
Proportion of total searches, rather than absolute numbers
Data filtered by region and by time period you choose
Comparison between up to five terms at once
Related queries, rising and top
Geographic distribution by country, region and city
Category and search type filters, including YouTube and Shopping
Among these, the normalized index is where almost every misreading begins.
A score of 100 marks the highest point of interest for your selected term, period and region. Change any one of those three and the entire curve redraws.
Two consequences follow, and both are frequently missed.
A term scoring 100 might represent fifty thousand monthly searches or four hundred. The tool does not tell you which, and nothing on screen hints at the difference.
A term scoring 20 is not “weak”. It is at twenty percent of its own peak within that window, which says nothing about its volume relative to anything else.
The proportion-based calculation adds a second layer worth understanding. Trends reports a term’s share of total searches, not its raw count.
This means a term can show declining interest while its actual search volume rises, simply because total search activity grew faster.
The related queries panel deserves more attention than it gets. The “rising” tab surfaces terms gaining momentum, which is genuinely useful for spotting shifts before they become obvious.
One practical note: comparisons only work between terms in the same selection. You cannot compare two separate searches, since each normalizes independently.
How to Read Seasonality and Trends Correctly?
Reading the curve well is a skill, and most errors come from looking at too short a window.
Set your timeframe to five years
This is the single most important setting, and the default rarely matches what you need.
Twelve months shows you a line. Five years shows you a pattern, and the difference determines whether you are looking at seasonality or at an actual trend.
A term rising sharply over twelve months might be entering its annual peak for the fourth consecutive year. On a five-year view, that is obvious. On a one-year view, it looks like growth.
Make the five-year view your default and zoom in afterwards.
Distinguish the four curve shapes
Four patterns cover almost everything you will encounter, and each calls for a different decision.
Seasonal curves repeat on a predictable annual cycle. Garden furniture, winter coats, Halloween costumes. The question here is not whether to sell but when to launch, which usually means six to eight weeks ahead of the rise.
Growing curves climb steadily across years without returning to their starting point. These represent genuine category expansion and are the most valuable to catch early.
Declining curves fall consistently across the same window. Declining does not mean dead, but it means competing for a shrinking pool.
Spike curves jump vertically then collapse. These are viral moments, news-driven or platform-driven, and by the time they appear in Trends the opportunity has usually passed.
Separate the trend from the season
Many terms are both seasonal and trending, which is where reading gets genuinely useful.
Compare each annual peak against the one before it. If peaks rise year over year, the category is growing beneath its seasonality. If peaks flatten or fall while the shape stays identical, the category is mature or declining.
That comparison tells you more than any single data point.
Watch for the three distortions
Three artefacts regularly produce false conclusions:
Term ambiguity. A product name that doubles as a common word mixes unrelated searches into your curve. Use the category filter or switch to a topic rather than a search term where one exists.
Methodology changes. Google has adjusted its data collection several times, producing step changes in historic curves that look like real shifts. A sudden level change across all terms in a period is a signal to investigate rather than interpret.
Low-volume noise. Terms with limited search activity produce erratic curves where randomness looks like pattern. If your line jumps between 0 and 100 repeatedly, the volume is too thin to read.
The limit this reading runs into
Everything above tells you about search interest. None of it tells you about commercial reality.
A rising curve means more people are searching. It does not tell you whether they buy, what margins the category supports, how saturated the advertising is, or which creatives are currently working.
Those questions need different data.
At Trendtrack available at app.trendtrack.io/en/sign-up, we preserve full ad history across Meta, TikTok and Google and refresh 700,000+ brand profiles every 24 hours.
What Google Trends Cannot Tell You?
The tool has a defined scope, and operating outside it produces confident decisions built on nothing. Here is what it does not cover.
Absolute search volume, since scores are relative
Whether anyone buys after searching
Conversion rates in the category
Margins the product supports
Who is already advertising against the term
Which creatives are working right now
Price points customers accept
Competitive saturation in paid channels
Among these, the gap between interest and purchase is the one that costs money.
People search for products they never buy. They compare, they research, they check prices and they close the tab. Rising search interest confirms curiosity exists, not that a market exists.
Several categories show strong, steady Trends curves and terrible unit economics, because the searching happens and the buying does not.
Competitive saturation is the second blind spot, and it is invisible by design.
A term with climbing interest tells you nothing about how many advertisers already compete for it. You can identify a genuinely rising category, enter it, and discover acquisition costs that make the margin unworkable.
Trends shows demand. It does not show how contested that demand already is.
Creative intelligence falls entirely outside the scope. Knowing a product category is growing does not tell you which angles convert, which hooks are fatiguing, or which brands have sustained a campaign long enough to prove it profitable.
That last signal matters more than most: an ad running for three months is profitable, or it would have been switched off.
The practical approach is to treat Trends as one input among several. Use it for timing and direction, then validate commercially elsewhere.
Conclusion: Timing Tool, Not a Validation Tool
Google Trends is excellent at one job and useless at another, and most operators ask it the wrong question.
Start with the misunderstanding that invalidates everything downstream. Trends reports relative interest, not search volume. A score of 100 marks that term’s peak within your selection. Two products can both show 100 while one gets fifty thousand monthly searches and the other gets four hundred.
Nothing on screen tells you which you are looking at.
Used correctly, four things come out of it reliably.
Seasonality, which tells you when to launch rather than whether to launch. Set your timeframe to five years by default, because twelve months shows a line while five years shows a pattern.
Direction over time, read by comparing each annual peak against the one before it. Rising peaks beneath a stable seasonal shape mean genuine category growth.
Geographic distribution, which shapes where you spend.
Rising related queries, which surface shifts before they become obvious.
Watch for three distortions while you read: term ambiguity where a product name doubles as a common word, methodology changes producing step shifts that look real, and low-volume noise where randomness resembles pattern.
Then there is what the tool structurally cannot answer.
Interest is not purchase. People search, compare, check prices and close the tab. A healthy curve confirms curiosity exists, not that a market does.
It also shows nothing about competitive saturation, margins, or which creatives are currently working. You can identify a genuinely rising category, enter it, and find acquisition costs that make the unit economics impossible.
The practical division is clean. Use Google Trends for timing and direction. Validate commercially somewhere else.


Ready to build a million-dollar brand?