ROAS Break Even Calculator
Calculate your ROAS (Return On Ad Spend) break-even point and CPA (Cost Per Acquisition) to optimize your advertising campaigns.
What is break-even ROAS?
ROAS (Return On Ad Spend) measures the revenue generated for every dollar spent on advertising. A ROAS of 3 means $3 of revenue per $1 of ads. But a ROAS of 3 is meaningless on its own: profitable for one store, a disaster for another. What decides it is your break-even ROAS — the exact ROAS at which a campaign stops losing money.
Below your break-even ROAS, every sale costs you money. Above it, every sale contributes profit. It is the single most important number to know before launching any Meta Ads or TikTok Ads campaign.
Break-even ROAS formula: how is it calculated?
The formula is simple:
- Break-even ROAS = Selling price ÷ Profit per sale before ads
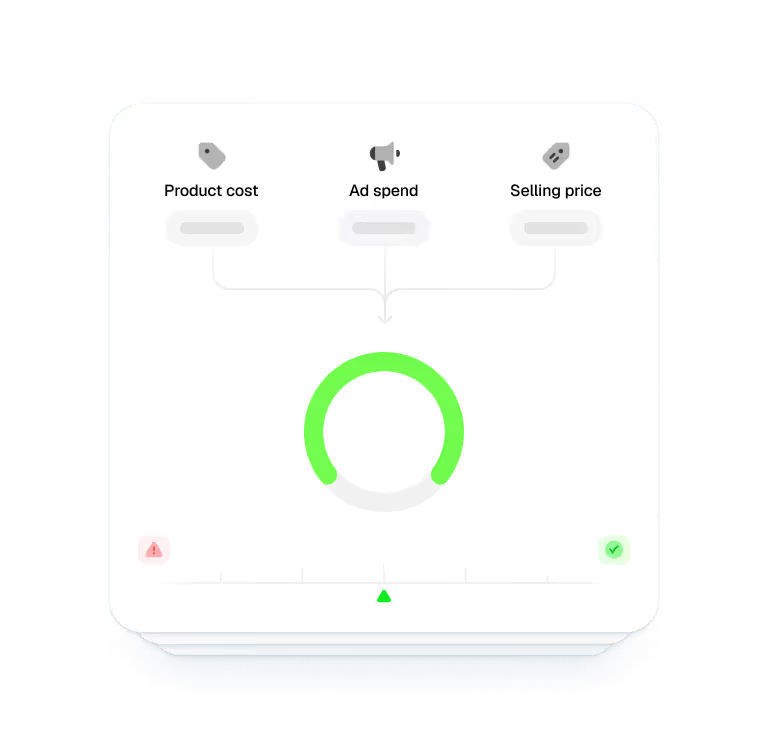
where profit before ads = selling price − product cost − shipping − transaction fees. The calculator also derives your break-even CPA (Cost Per Acquisition) — the maximum you can pay for one customer before losing money:
- Break-even CPA = Profit per sale before ad spend
Break-even ROAS examples
Example 1 — A healthy margin
- Selling price: $50
- Product + shipping + fees: $20
Profit before ads = $30. Break-even ROAS = 50 ÷ 30 ≈ 1.67, break-even CPA = $30. Any campaign above a 1.67 ROAS makes money — a very comfortable position.
Example 2 — A tight margin
- Selling price: $30
- Product + shipping + fees: $22
Profit before ads = $8. Break-even ROAS = 30 ÷ 8 = 3.75, break-even CPA = $8. This store needs an excellent campaign just to break even — most accounts can't sustain a 3.75+ ROAS at scale.
How to use the ROAS break-even calculator?
- Choose your currency ($, € or £).
- Selling price — what the customer pays.
- Product cost — your unit cost.
- Other costs per sale — shipping, payment fees, packaging.
The calculator instantly returns your break-even ROAS and your break-even CPA. Compare them with the actual figures in your ads manager: any campaign below the line is burning cash.
What is a good ROAS in e-commerce?
- ROAS below break-even: losing money — fix the offer or kill the campaign.
- ROAS at 1–1.5× break-even: profitable but tight — optimize creatives and AOV.
- ROAS at 1.5–2× break-even: solid — ready to scale progressively.
- ROAS above 2× break-even: excellent — scale aggressively while it lasts.
The takeaway: never judge a ROAS in absolute terms. A 2.5 ROAS is great with a 1.6 break-even and catastrophic with a 3.75 break-even.
How to lower your break-even ROAS?
- Increase your margin — negotiate product costs or raise your price; both lower the ROAS you need (margin calculator).
- Raise average order value — bundles and upsells raise revenue per purchase without raising acquisition cost.
- Improve conversion rate — a better product page turns the same clicks into more sales.
- Test stronger creatives — the fastest ROAS lever; find angles that already work with our Hook Generator.
Go further with Trendtrack
Your break-even ROAS tells you the bar to clear. Trendtrack helps you clear it: see which ads are actually scaling in your niche, analyze the stores behind them, and pick products whose economics leave room for ads — all updated every 24 hours.
Discover our other free tools too:
Know your break-even before you spend a single dollar.


Frequently asked questions
Can't find the answer to your question?
Contact us by clicking here.
TrendTrack is the ecommerce intelligence platform built around one obsession: giving you the most accurate, most current market data available. Every store, every ad, every mail, every spend signal, updated every 24 hours. Because knowing what's winning in ecom right now is only useful if "right now" actually means right now.
Most tools show you what was working last month. We show you what's working today. Our infrastructure scans the entire Shopify and Meta ecosystem daily, 2 to 3 million new ads indexed every 24 hours. No delays, no editorial filters, no subjective picks. Just the market, live.
Anyone who makes ecom decisions and can't afford to be wrong. Beginners validating a product before spending a dollar. Operators whose ads are burning out and need fresh angles. Brands and agencies that need to see market shifts before they happen. If your decisions depend on knowing what's actually working right now, this is your tool.
It's one of the best ways to de-risk your first moves. Instead of guessing, you can see exactly which products are gaining traction, which ads are scaling, and which niches are heating up, all in real time. You're not betting on a hunch. You're betting on live market signals.
Yes. The fastest way to find a new angle is to see what's already working, across your niche and beyond. TrendTrack gives you access to millions of active creatives, ranked by performance signals, updated daily. The next winning hook is already running somewhere. We help you find it.
It depends on your plan. Each plan comes with its own access levels and usage capabilities. Before subscribing, we recommend checking our pricing page to make sure you pick the plan that fits your needs.
Yes. No commitment, no lock-in. Cancel directly from your account whenever you want.
Ready to build a million-dollar brand?
.avif)