
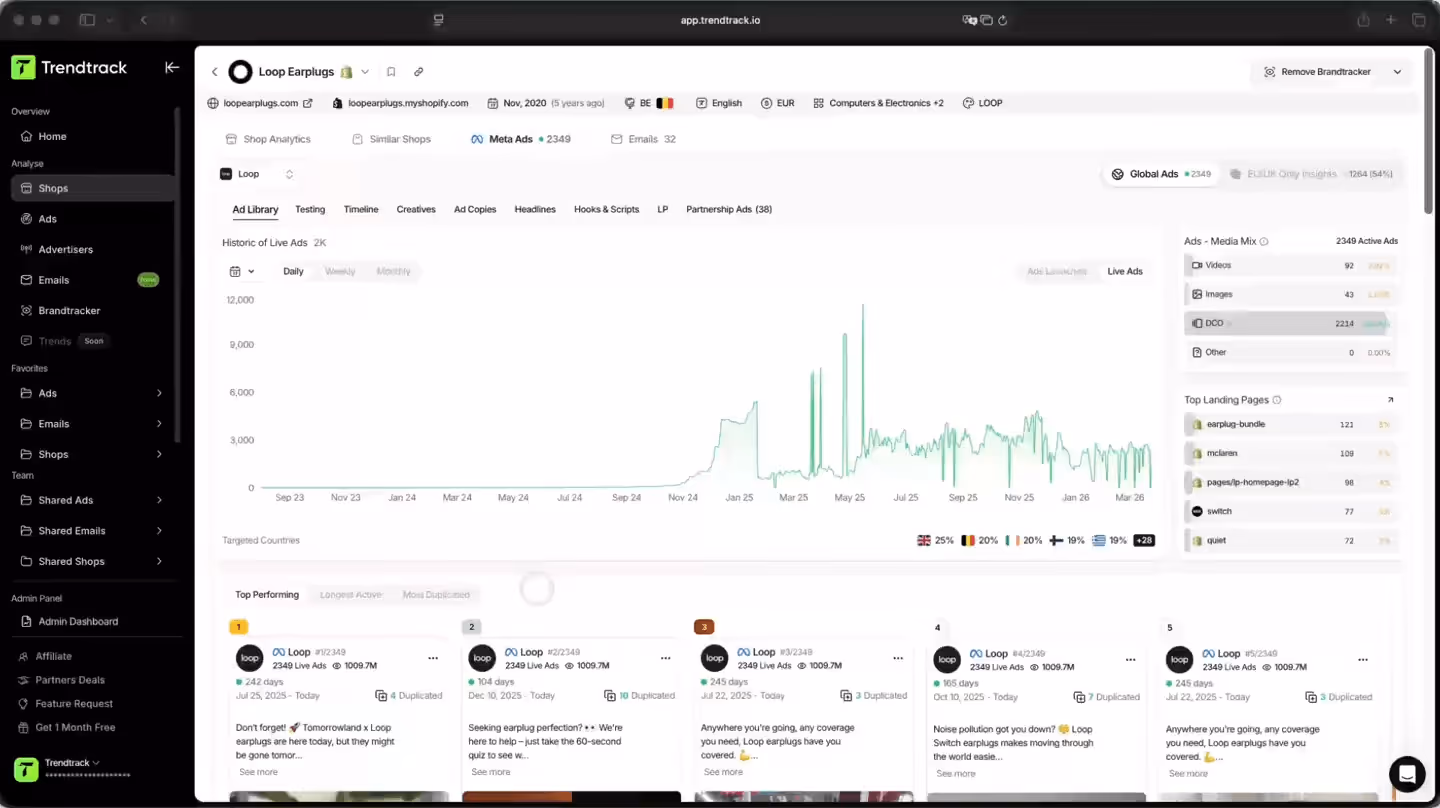
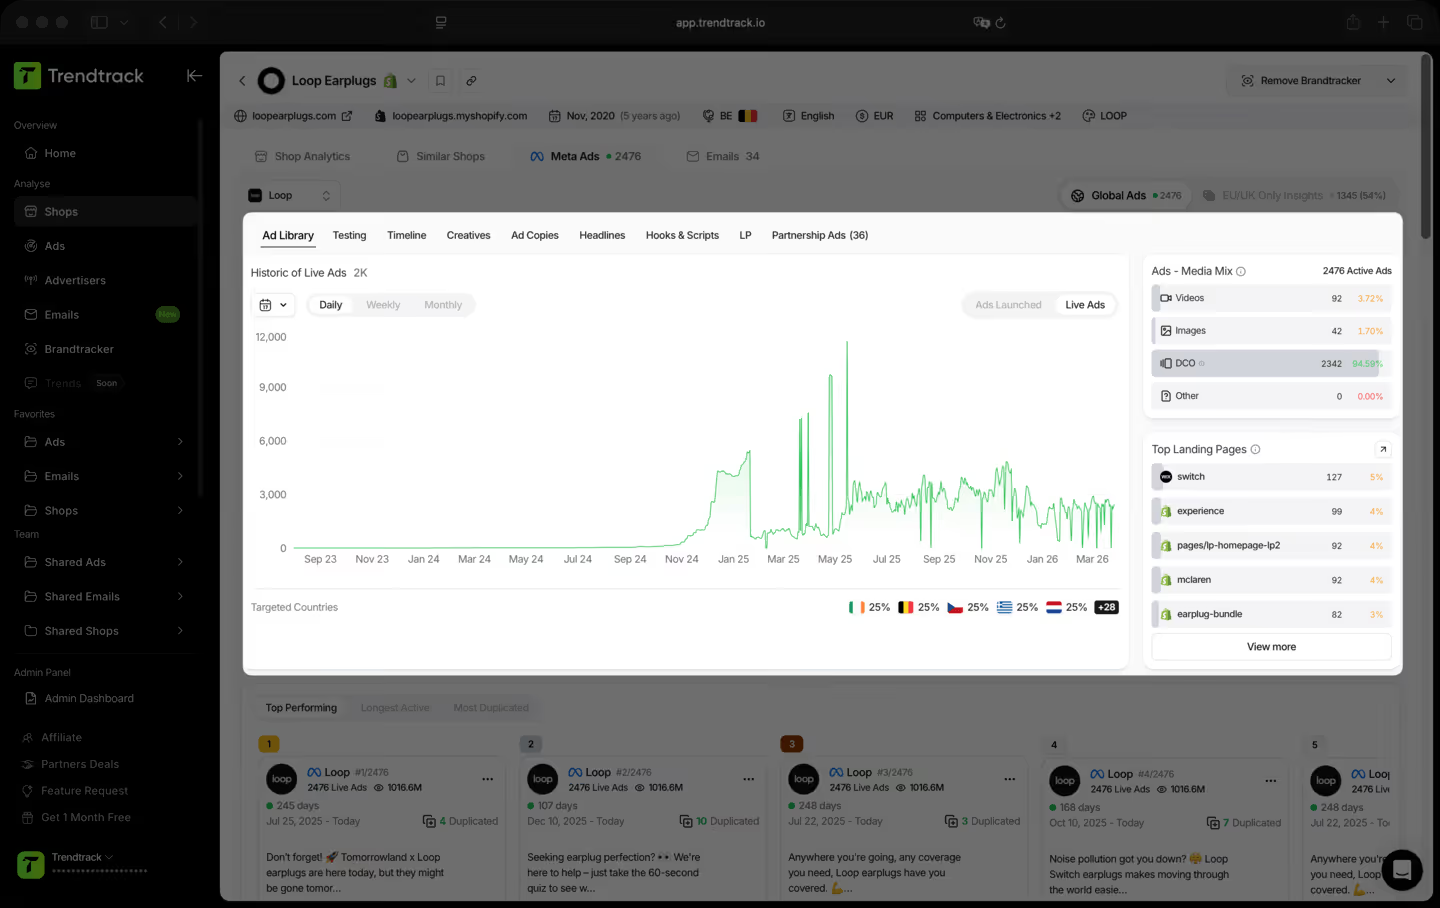
Deep dive into any page's ad strategy and performance
A dedicated tab within Shop Analytics that shows complete insights into a shop's Meta ad campaigns. Analyze their ad history, top performing ads ranked by performance, media mix, landing pages, spending patterns, and reach data. Understand what works for them and use these insights to improve your own strategy.
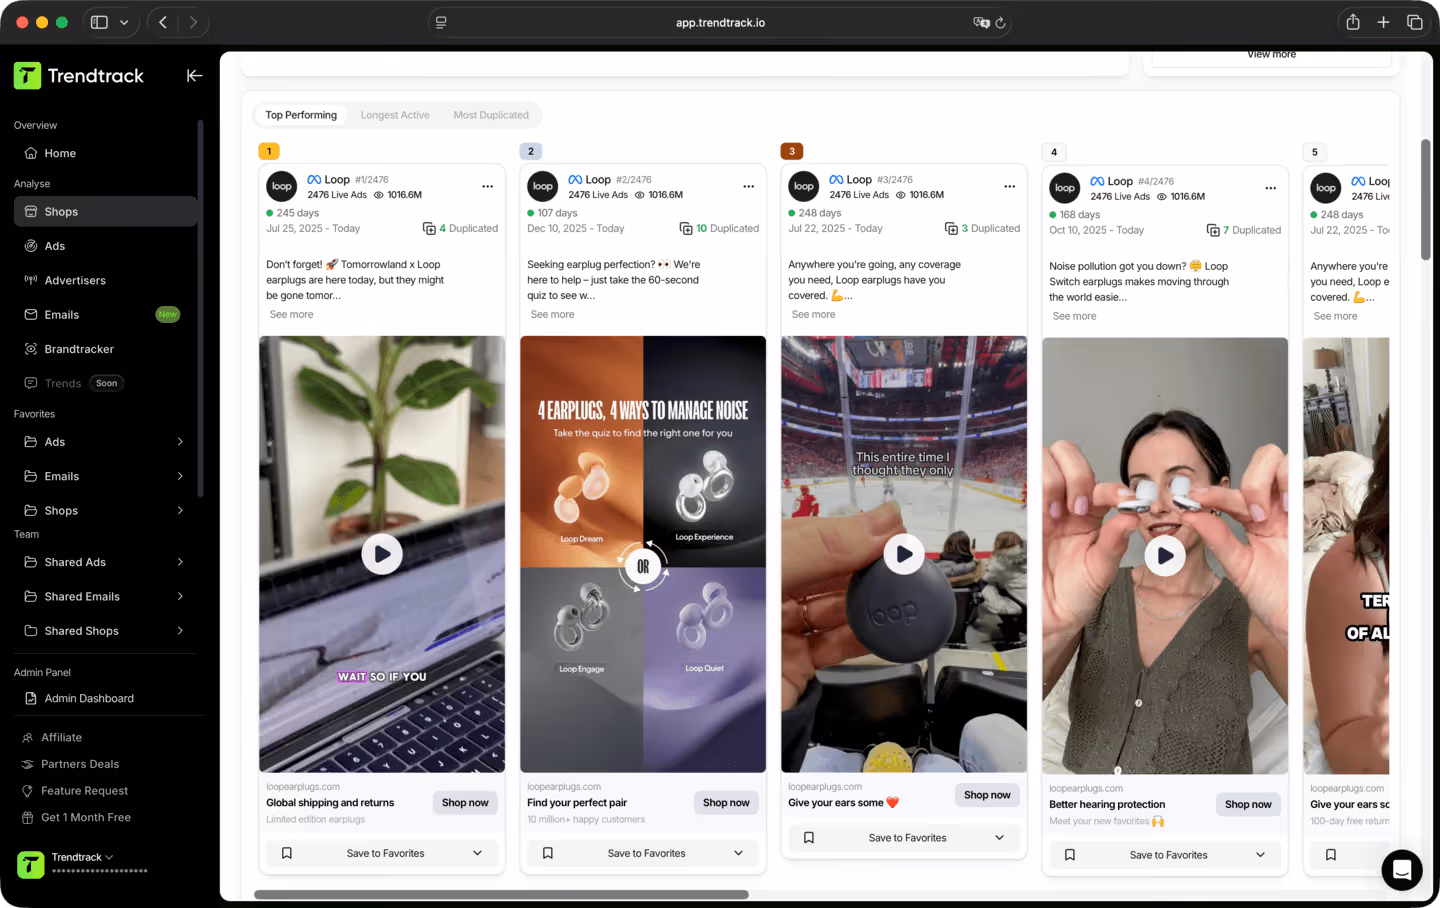
A smarter way to analyze any shop’s Meta ad strategy
Dive into a shop's complete Meta ad strategy. Explore their full ad history, spot their top performers by spend and reach, study their media mix, and extract the patterns behind their best campaigns.

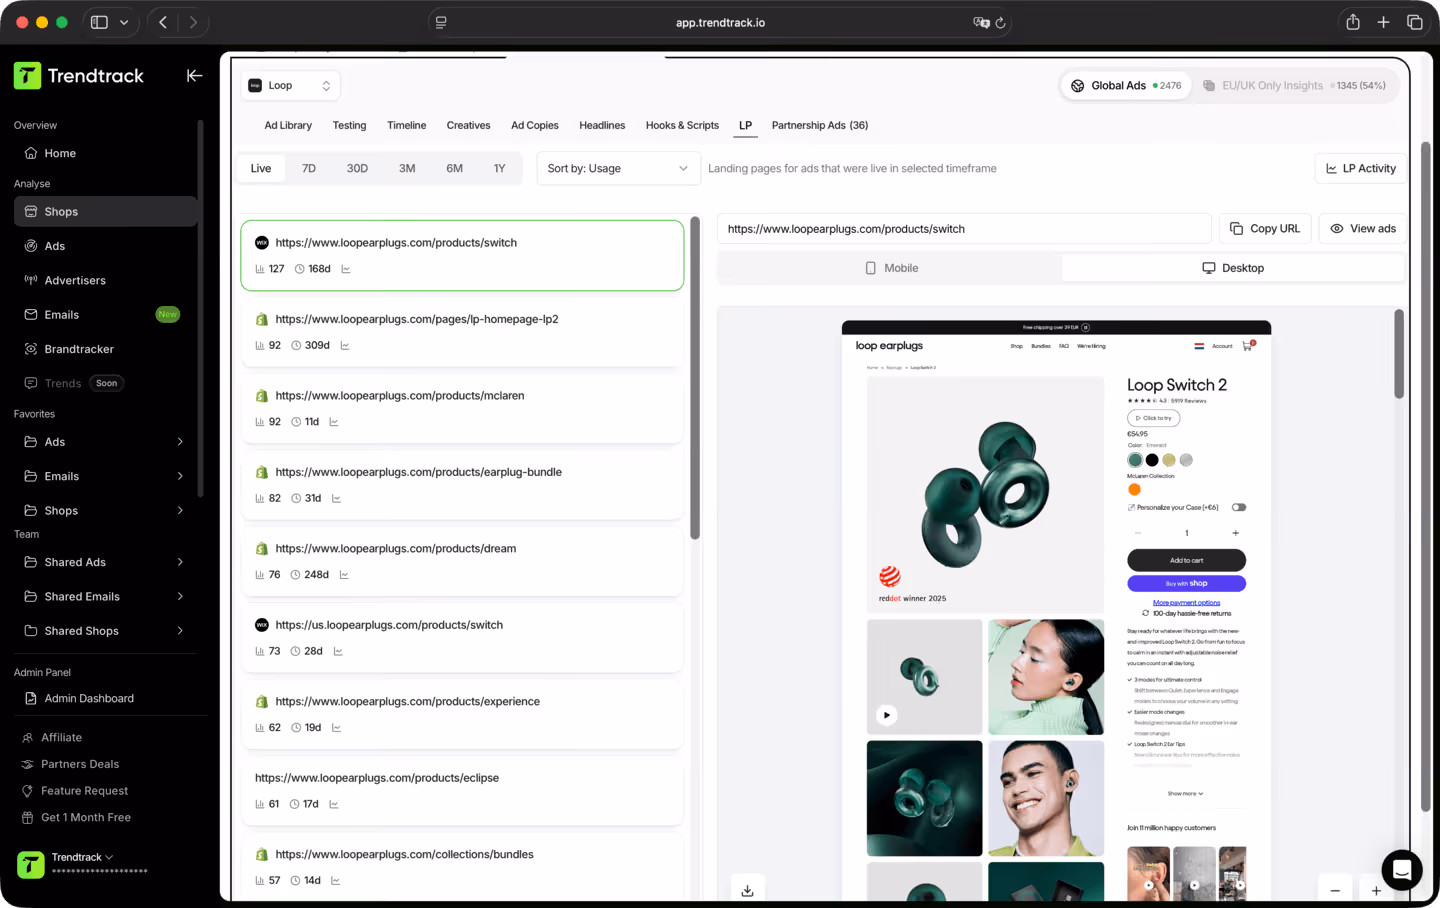
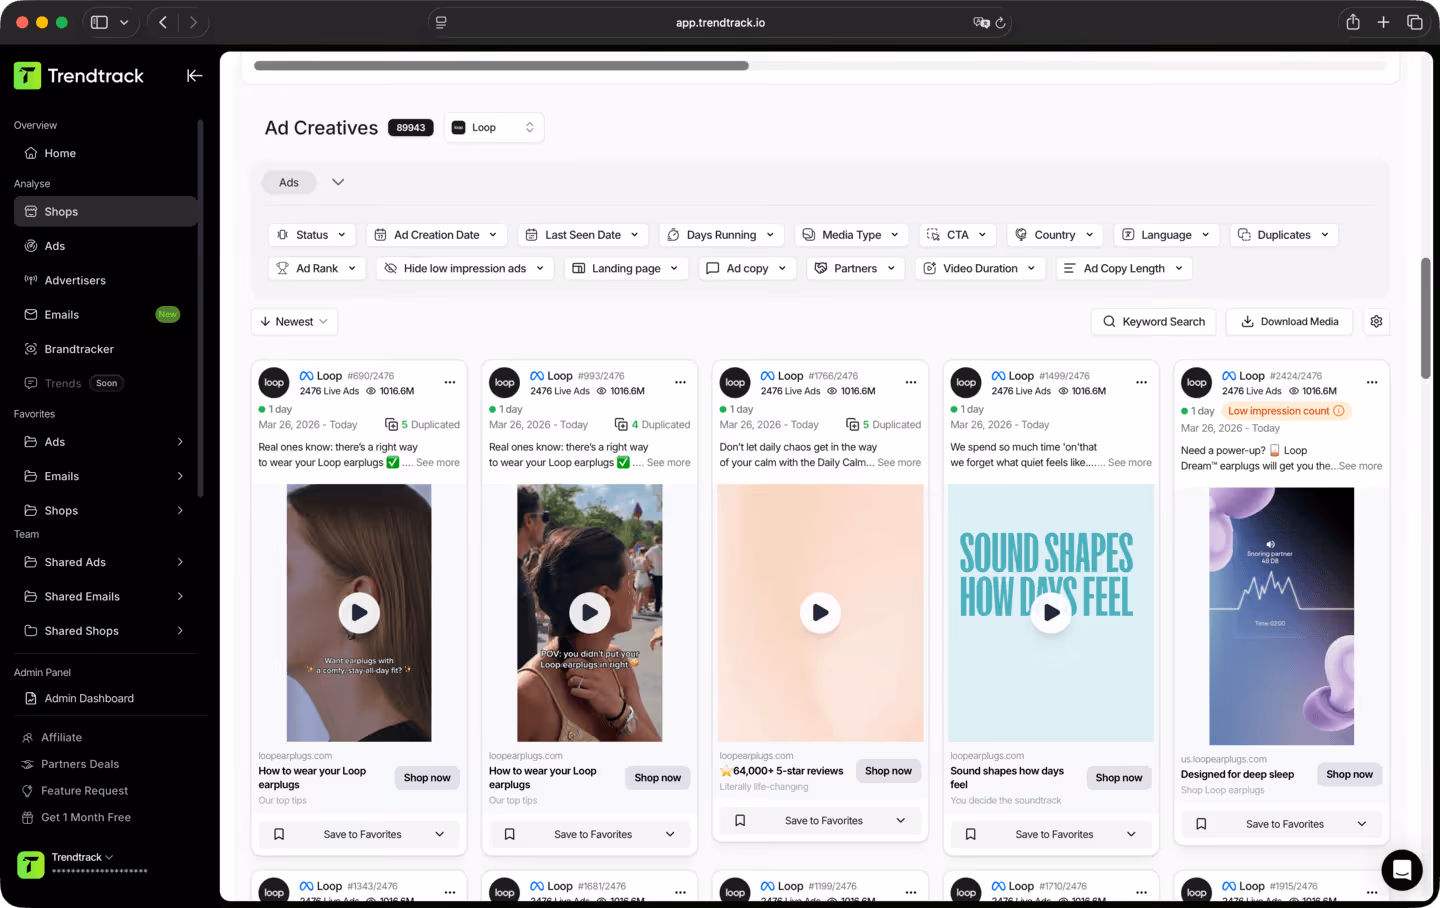
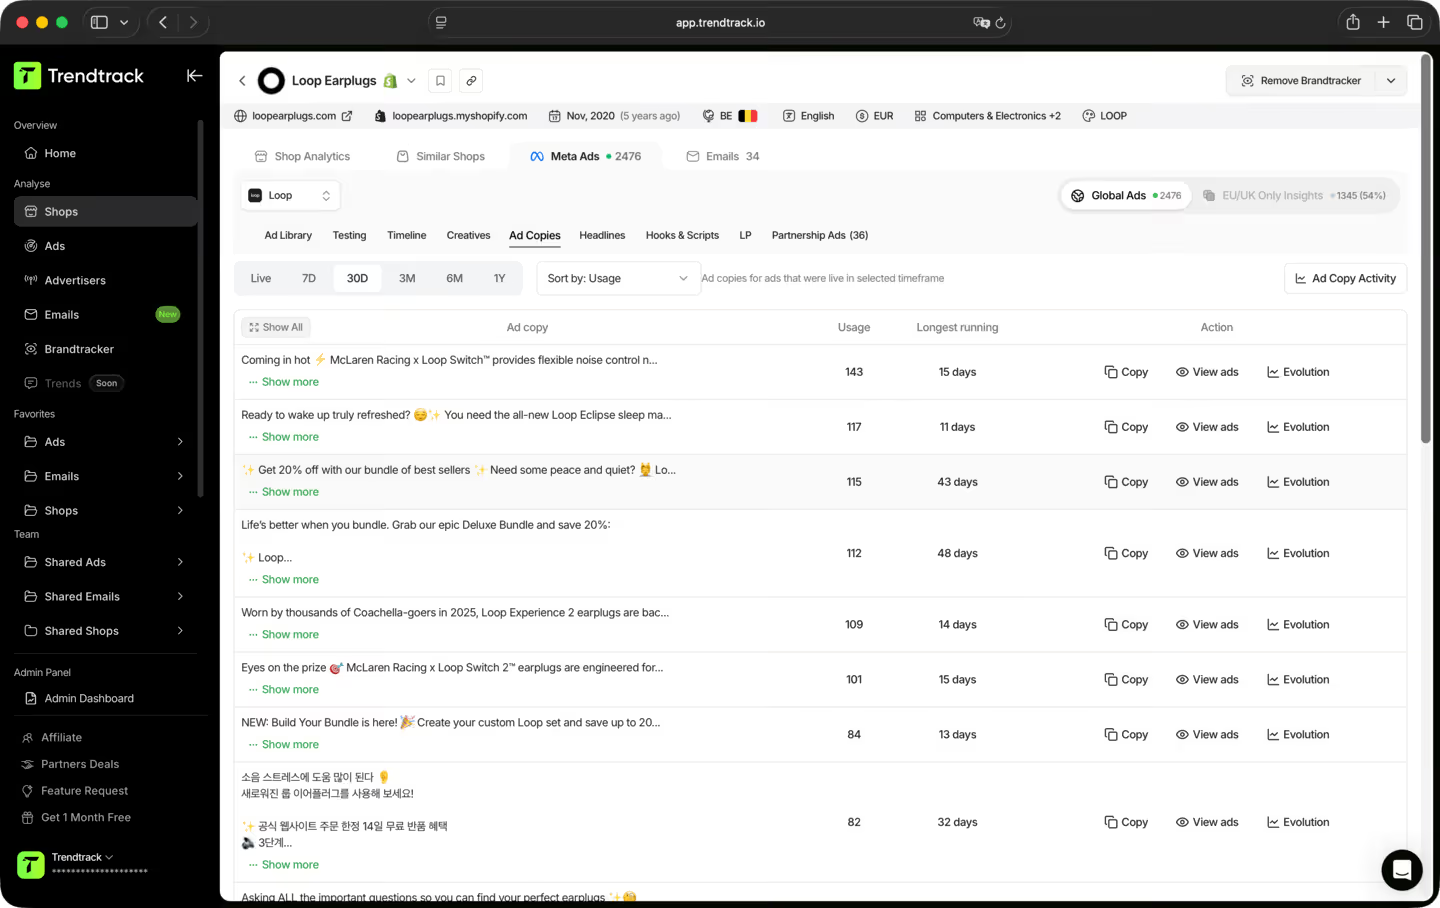
A simple workflow to break down performance, patterns, and top creatives


Frequently asked questions
Can't find the answer to your question?
Contact us by clicking here.
TrendTrack is the ecommerce intelligence platform built around one obsession: giving you the most accurate, most current market data available. Every store, every ad, every mail, every spend signal, updated every 24 hours. Because knowing what's winning in ecom right now is only useful if "right now" actually means right now.
Most tools show you what was working last month. We show you what's working today. Our infrastructure scans the entire Shopify and Meta ecosystem daily, 2 to 3 million new ads indexed every 24 hours. No delays, no editorial filters, no subjective picks. Just the market, live.
Anyone who makes ecom decisions and can't afford to be wrong. Beginners validating a product before spending a dollar. Operators whose ads are burning out and need fresh angles. Brands and agencies that need to see market shifts before they happen. If your decisions depend on knowing what's actually working right now, this is your tool.
It's one of the best ways to de-risk your first moves. Instead of guessing, you can see exactly which products are gaining traction, which ads are scaling, and which niches are heating up, all in real time. You're not betting on a hunch. You're betting on live market signals.
Yes. The fastest way to find a new angle is to see what's already working, across your niche and beyond. TrendTrack gives you access to millions of active creatives, ranked by performance signals, updated daily. The next winning hook is already running somewhere. We help you find it.
All our data comes directly from real sources, no invented numbers, no estimates pulled from thin air. Ad spend is sourced straight from Meta's own data. Store traffic is powered by SimilarWeb, the industry's most reliable traffic intelligence provider. Refreshed every 24 hours, it gives you the most accurate read of what's scaling right now, strong enough to spot winners, track emerging brands, and flag trends before they peak.
It depends on your plan. Each plan comes with its own access levels and usage capabilities. Before subscribing, we recommend checking our pricing page to make sure you pick the plan that fits your needs.
Yes. No commitment, no lock-in. Cancel directly from your account whenever you want.
Ready to build a millions dollars brand ?
.avif)
