10 Example Shopify Stores Winning With Traffic and Ads


Studying high-performing Shopify stores sharpens your strategy beyond surface-level design inspiration. This guide examines 10 successful stores across fitness, fashion, electronics, and outdoor gear.
You'll discover what makes them worth studying and how to benchmark their traffic, ads, and creative patterns using Trendtrack.
Learn to spot seasonal spikes, identify effective ad creatives, and compare landing page strategies. Understand what separates scaling brands from others. These stores offer concrete signals for validating new markets, planning campaigns, and analyzing competitor strategies.
1. Gymshark
Gymshark is a Shopify store too large to ignore. Their growth comes from several factors: international demand, a massive product catalog, and a focused advertising strategy. For growth managers or creative strategists, Gymshark serves as a benchmark for what effective scaling looks like.

Why it is worth studying
Gymshark operates like a system. Trendtrack’s store analytics show it’s a Shopify store (gymsharkusa.myshopify.com) launched in 2017. It uses a custom theme named GS2 and offers a deep product catalog with 7,506 products.
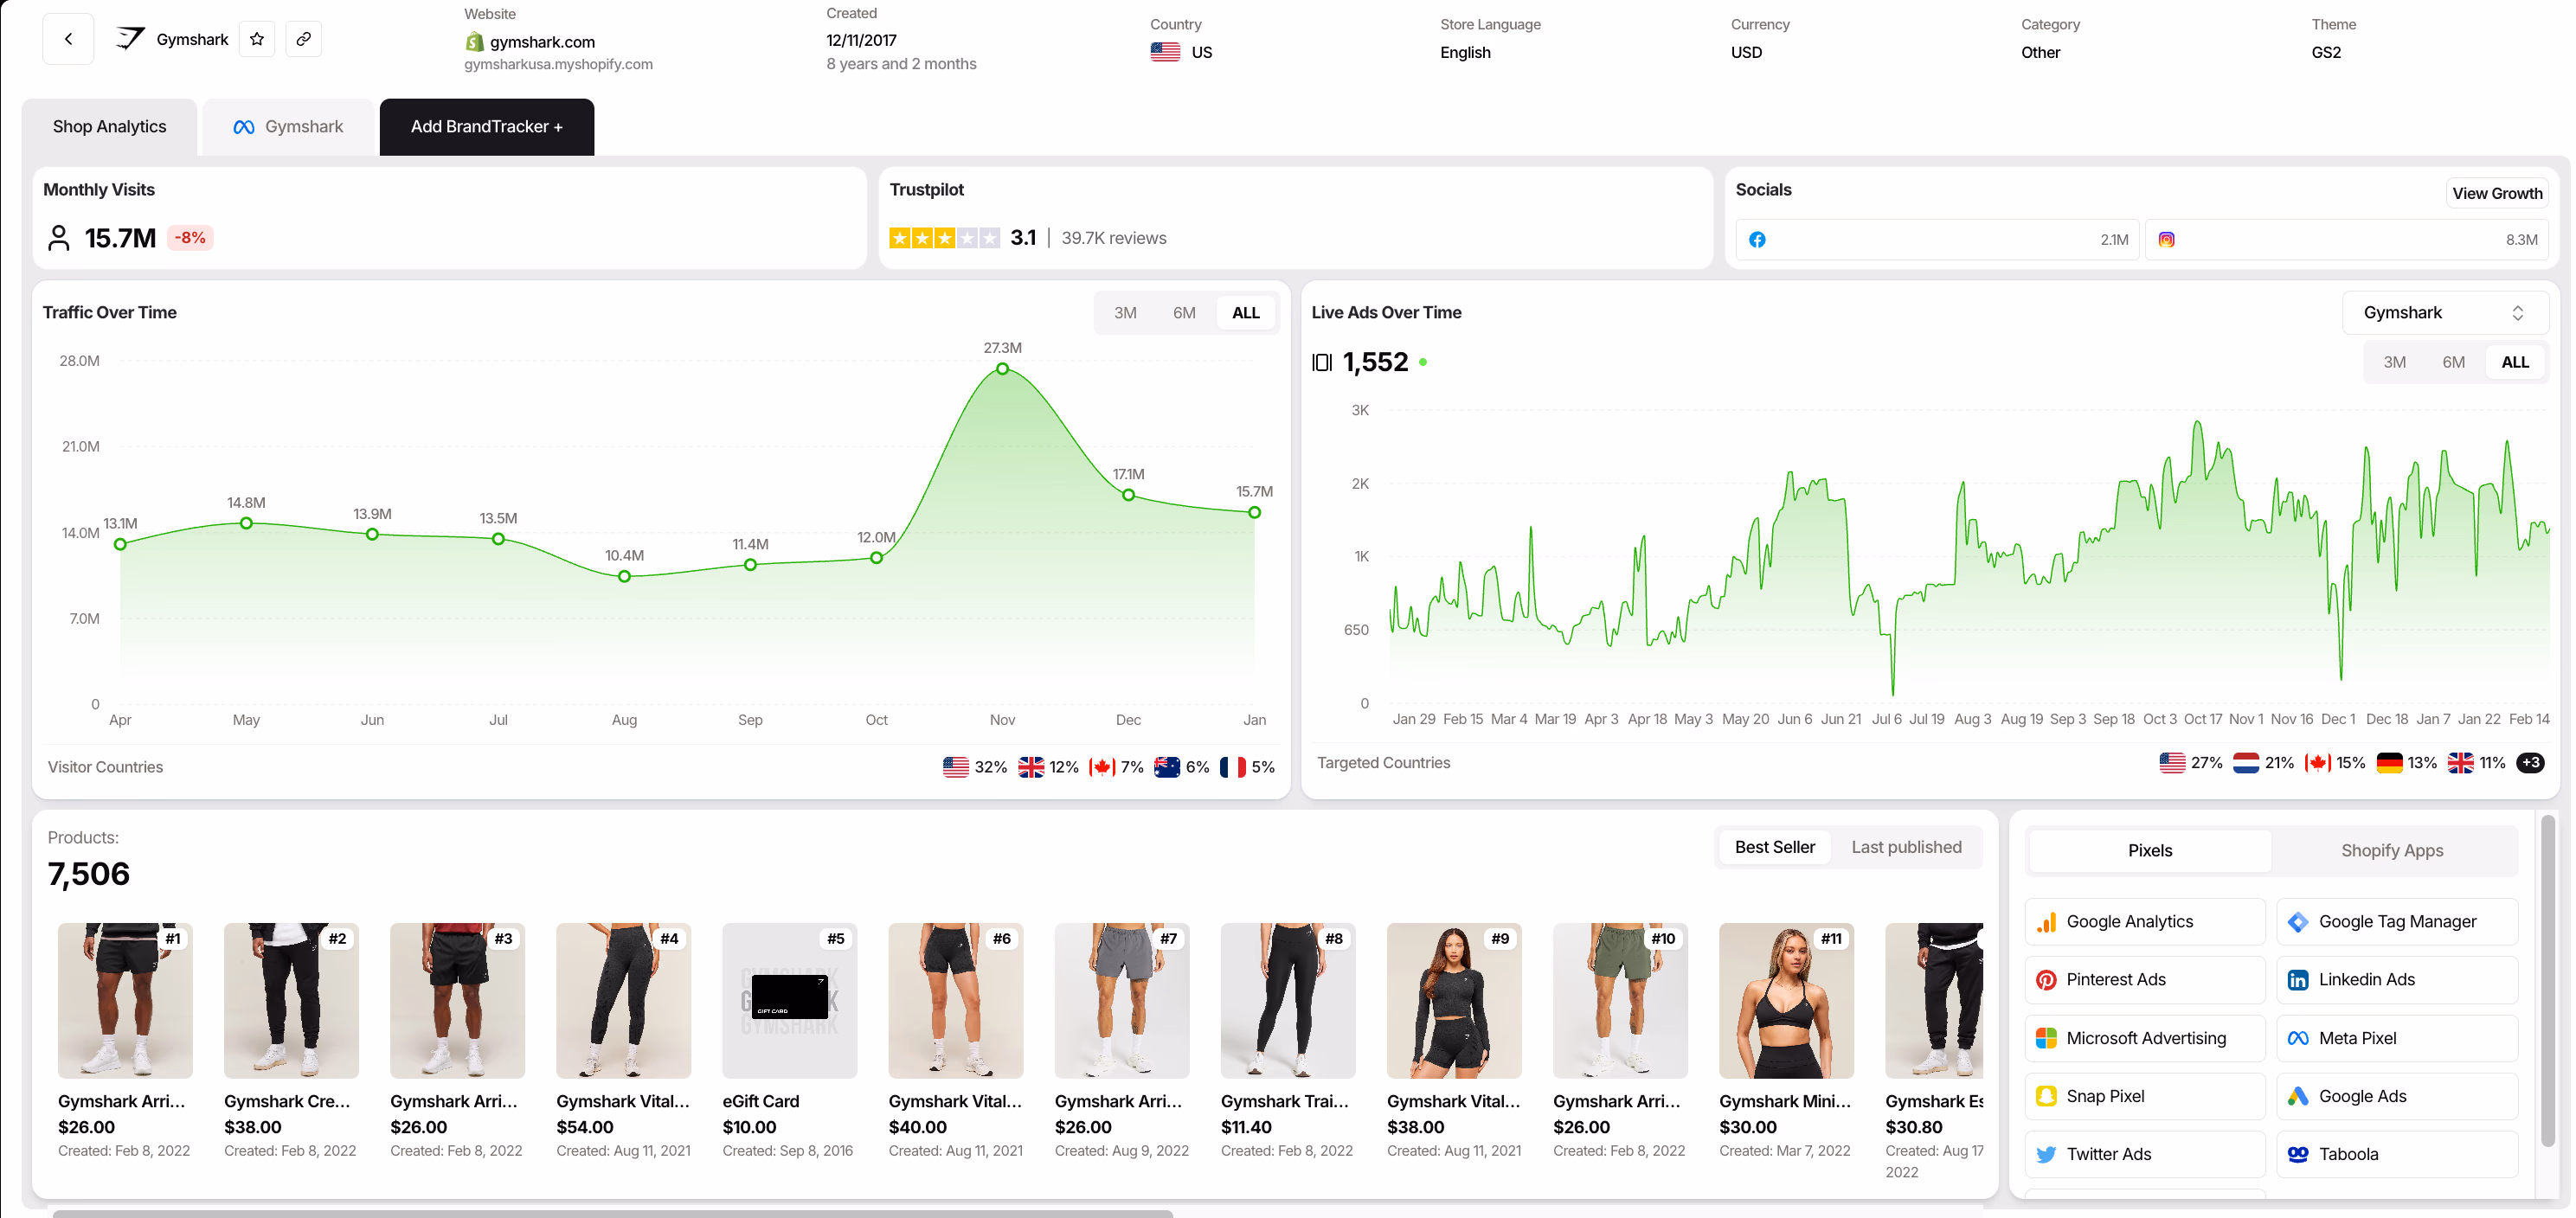
This size changes the approach. Rather than relying on one hero SKU, they build a machine that supports many angles, landing pages, and creative variations.
One overlooked detail is the Trustpilot rating of 3.1. This score is far from perfect, yet the brand still generates massive traffic. This shows that traffic and ad behavior often offer more insight than reputation scores when benchmarking competitors.
What to benchmark in Trendtrack
Gymshark averages 15.7 million monthly visits, but demand fluctuates throughout the year. The traffic spikes in November to 27.3 million visits, revealing a clear seasonal trend.
Categories like fitness, apparel, and gifting can use this signal to plan their testing calendars and measure lifts. They'll determine whether improvements come from the market or their offers. Learn how to calculate Facebook ads budget to allocate spend effectively.
Geography also matters. Trendtrack's "Targeted Countries" data shows a diverse traffic split:
- US: 27%
- Netherlands: 21%
- Canada: 15%
This pattern reminds us that scaling does not always mean spending more. Instead, it often means proving the offer in multiple countries before expanding further. Trendtrack's filters compare stores by visitor country, language, and currency to identify regional or multi-market demand.
The tracking setup matters too. You can see multiple pixels installed. Google Analytics, Meta Pixel, and Snap Pixel. This indicates the brand measures and retargets across channels, which speeds up creative testing.
To use this data in Trendtrack, add Gymshark as a benchmark profile in Brandtracker. Traffic, product count, and live ads reveal whether a brand scales through product variety, advertising, or both.
2. Fashion Nova
Fashion Nova wins through scale and speed, breaking conventional advice. For growth managers and creative strategists, it offers a clear example of a Shopify store where:

- The catalog acts as a content engine
- Ads serve as the distribution layer
Why it is worth studying
Most brands focus on a single hero product and angle. Fashion Nova takes the opposite approach with relentless merchandising volume and constant newness.

The Trendtrack dashboard shows the scale clearly. Fashion Nova gets 34.7 million monthly visits and offers an astonishing 25,000 products. This setup is not typical for DTC brands. It allows the store to match current market demand on a daily basis, rather than relying on plans made weeks ago.
Check out real DTC ads examples to see how brands at this scale approach creative.
Fashion Nova's demand also shows a seasonal surge, peaking in December with 36.3 million visitors. Creative strategy, offers, and landing page design must adapt between peak and quiet seasons.
What to benchmark in Trendtrack
Fashion Nova provides solid reference points for what high-volume apparel looks like when it works effectively. Key points to analyze in Trendtrack include:
- Traffic size and seasonality: The store consistently hits 34.7 million monthly visitors, with a peak of 36.3 million in December. This lets you model seasonality accurately instead of guessing market trends.
- Catalog size as a core strategy: With 25,000 products, the brand does not rely on a limited set of SKUs. This means creative efforts focus on constantly rotating the “face” of the brand rather than pushing one product repeatedly.
- Customer trust infrastructure: A Trustpilot rating of 4.3 shows trust signals are critical at this scale. Building and maintaining trust is essential for converting traffic from cold ads.
Fashion Nova's ability to test and iterate creative at scale is a key driver of their success. Explore Facebook ad examples from high-volume sellers to see how they structure ads across their product range.
3. Skims
Skims is a store worth studying. Especially, if you want to see clear data on traffic spikes, ad volume, and how a large-scale brand sets up their site.

Why it is worth studying
Most posts about example Shopify stores focus on design. Skims is different because its business strategy shows clearly in the numbers.
Skims gets around 9.9 million monthly visits. The site experiences a notable surge reaching 13.3 million visits in November. This pattern matters. It shows the brand doesn't rely only on steady demand, but builds to capitalize on peak attention.
If you manage growth, this reminds you that your calendar should be part of your sales funnel.
A detail often overlooked. The store uses the DAWN Shopify theme. This theme is not special by itself. Instead, it provides a clean baseline.
What to benchmark in Trendtrack
To validate an idea without guessing, check store-level data in Shops and Brandtracker → Website before creating creatives. From Skims, benchmark:
- Traffic volume and seasonality: Skims receives 9.9 million monthly visits, peaking at 13.3 million in November. Filter Trendtrack by traffic min/max to identify brands that succeed during specific seasons rather than daily.
- Theme used: The dashboard shows DAWN. Filter by Shopify Theme to compare similar stores and isolate what drives better traffic or ad results.
- Market and language details: Check Visitor country to avoid comparing stores targeting different regions.
- Pixel stack maturity: A broader tracking setup indicates the store runs structured tests and scales strategies effectively.
Use Trendtrack's Chrome Extension for faster work. Browse any store and instantly see active ads, theme, and apps without switching tools.
4. Gonoise
GoNoise demonstrates how to sustain demand from product launches by prioritizing social distribution and steady releases. Then, they use ads to accelerate growth.
Why it is worth studying
The GoNoise dashboard shows that “big” does not always mean global-first. The store primarily serves India, with INR pricing, yet operates like a modern performance brand.
It has a wide product range. These include smartwatches and audio devices, many marketing signals, and tools for attribution and iteration.

Key highlights include 5.7 million monthly visits, large social audiences like Instagram with 862.1K followers. And Facebook with 701.0K followers.
It is a mature setup with the store over 6 years old. This profile belongs to a brand that built its traffic and distribution steadily through product launches.
What to benchmark in Trendtrack
Study the structure behind headline traffic numbers using GoNoise to replicate successful approaches. In Trendtrack, audit stores by analyzing traffic trends, tracking tools, and SKU launch strategy. Key benchmarks include:
- Monthly visits: 5.7 million – market leader reference
- Market/currency: India (INR) – contextualizes pricing and demand
- Theme: SECTION PLUS – reveals UX patterns and conversion opportunities
- Tracking stack: Google Analytics, Meta Pixel, Google Tag Manager – indicates performance focus and rapid iteration
- Social proof: Instagram 862.1K, Facebook 701.0K followers – explains creative scalability through organic distribution
5. EcoFlow
EcoFlow is a Shopify store that shows how to run high-ticket ecommerce at scale using data, not just vibes. The data reveals what drives demand, where it comes from, and how the brand tracks performance so every campaign improves.
Why it is worth studying
Many example Shopify stores are fun to look at but don’t clarify what drives performance. EcoFlow offers a clear performance story you can measure.
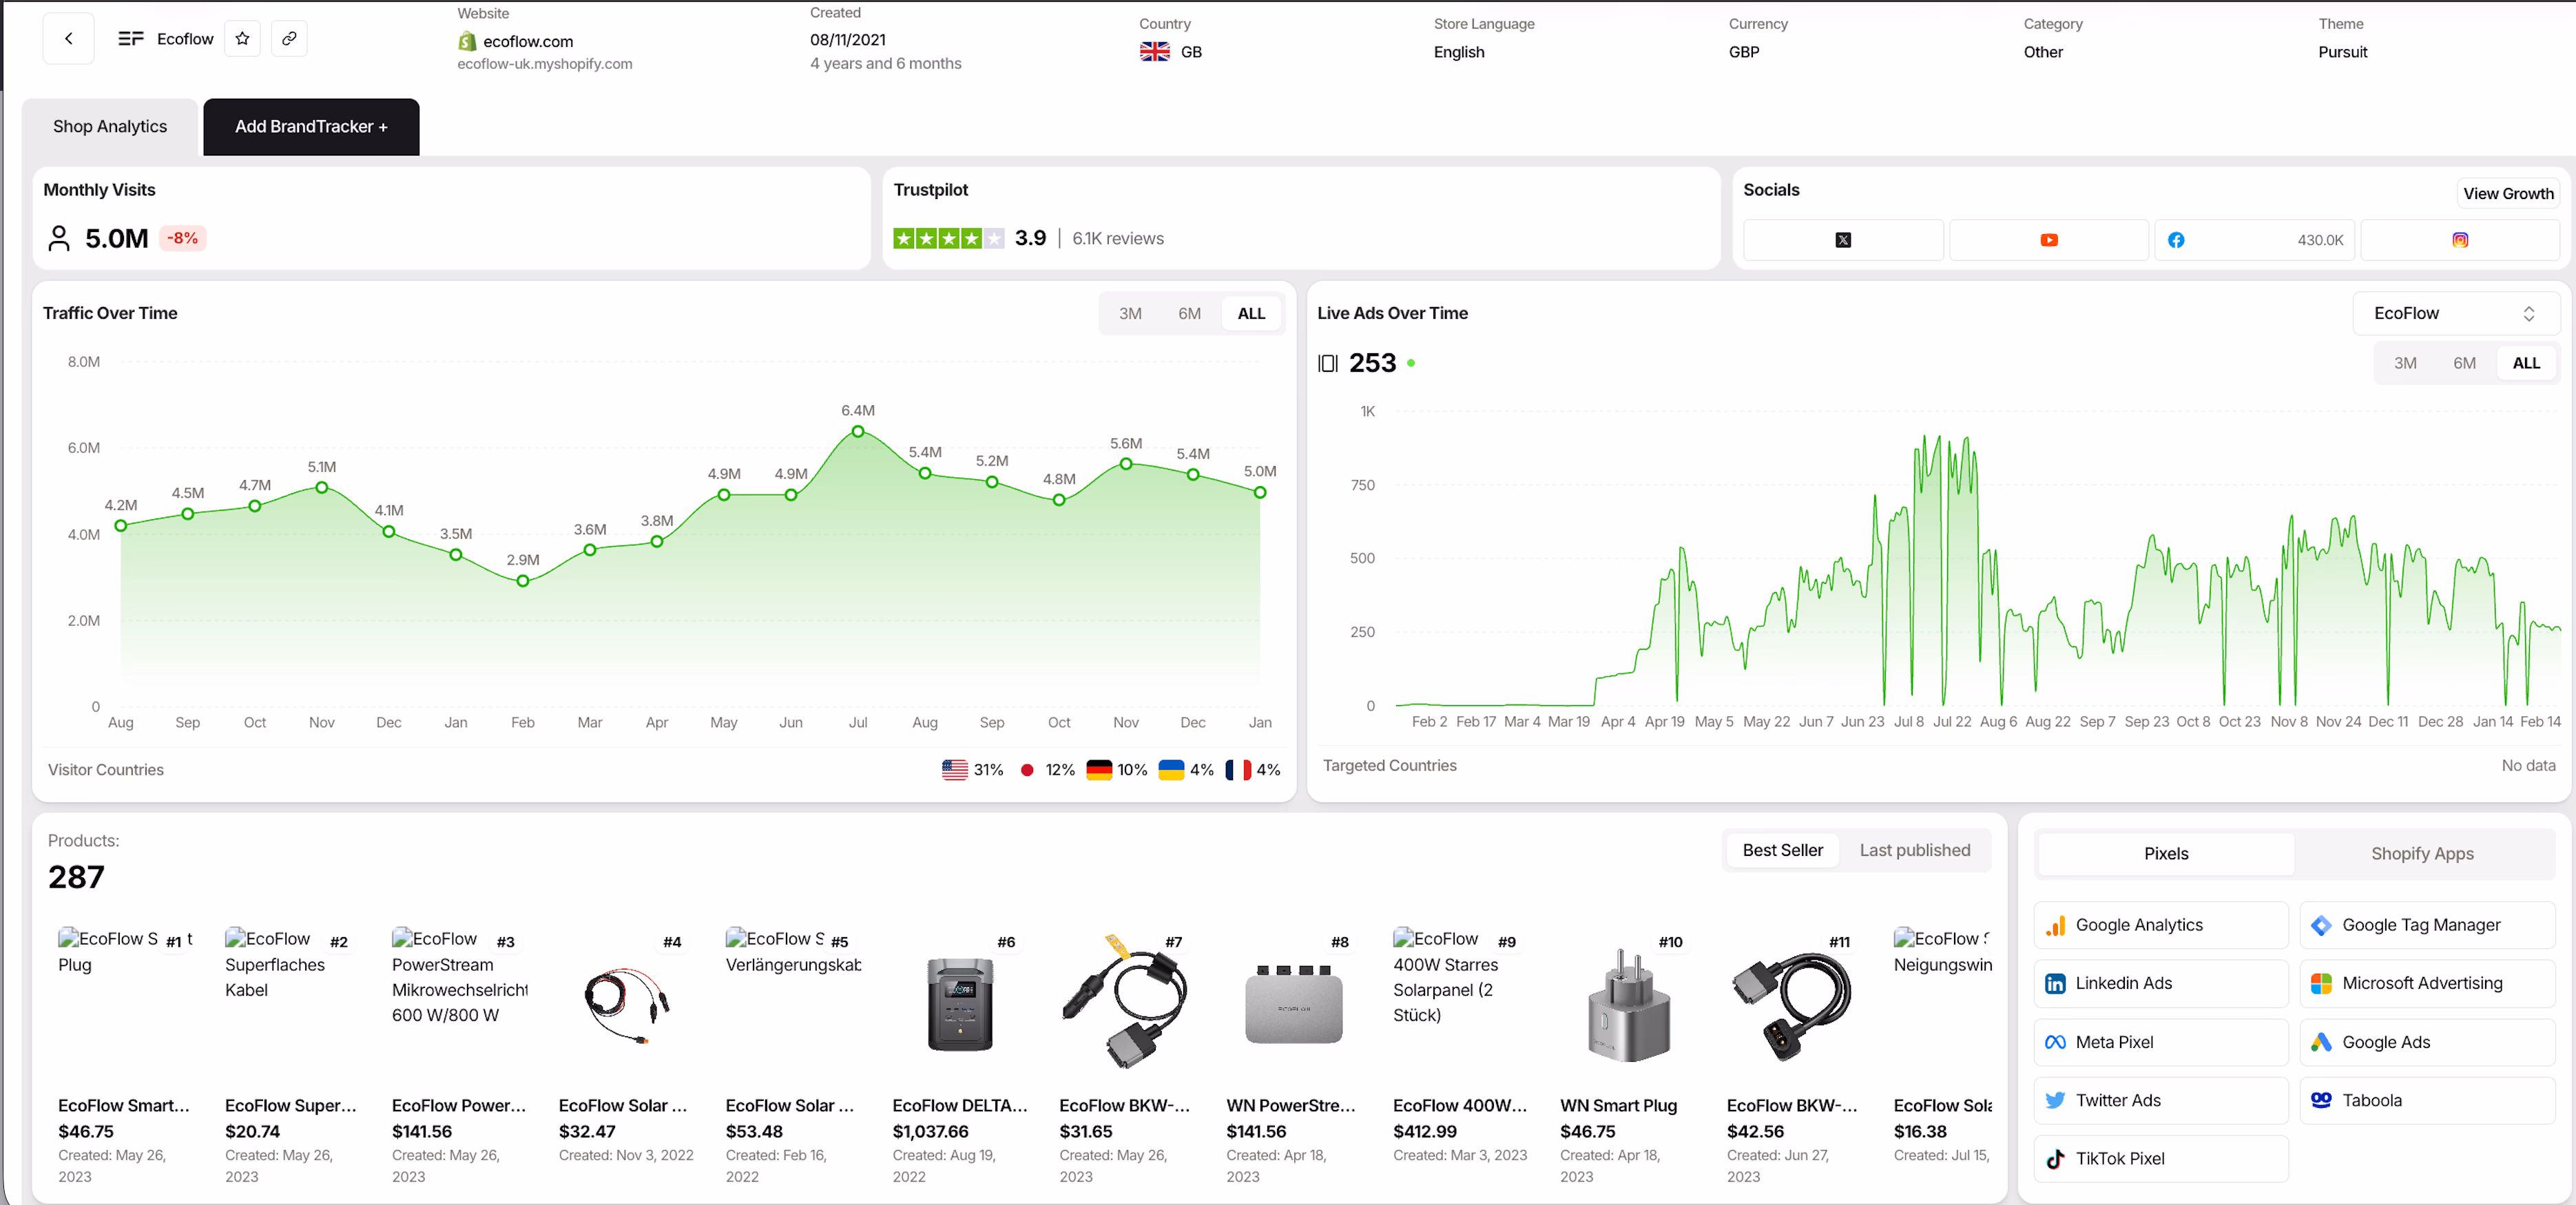
The screenshot above shows a store reaching 5.0 million monthly visits with a traffic peak of 6.4 million. This is not just a temporary spike, it reflects steady, global demand.
Their products are high-ticket. For example, the EcoFlow DELTA priced at $1,037.66. They focus more on building trust and tracking user behavior than on flashy merchandising.
What to benchmark in Trendtrack
Validate ideas with concrete data from Trendtrack rather than copying design elements. Understanding how to improve ROAS helps you extract key store metrics and set realistic goals:
- Monthly visits: 5.0 million – Maximum addressable demand
- Traffic peak: 6.4 million – Seasonal trends for marketing planning
- Product count: 287 – Business diversification beyond single SKU
- Visitor countries: US 31%, Germany 12%, Japan 10% – Global reach and localization opportunities
- Theme: Pursuit – Benchmark pattern recognition
- Origin: United Kingdom – Brand context and traffic sources
- Trustpilot: 3.9 stars, 6.1K reviews – Trust indicators linked to conversion rates.
{{cta-2}}
6. Owala
Owala appears simple at first glance, with drinkware, a focused product range, and a clean website. However, its numbers reveal a well-oiled operation. If you want an example of a Shopify store where focus beats complexity, Owala is a strong case to examine.

Why it is worth studying
Owala balances three challenges many stores face. Scale, focus, and momentum. Its dashboard snapshot shows 6.7 million monthly visits, peaking at 9.8 million on the traffic timeline. Yet, the catalog remains lean with only 58 products.
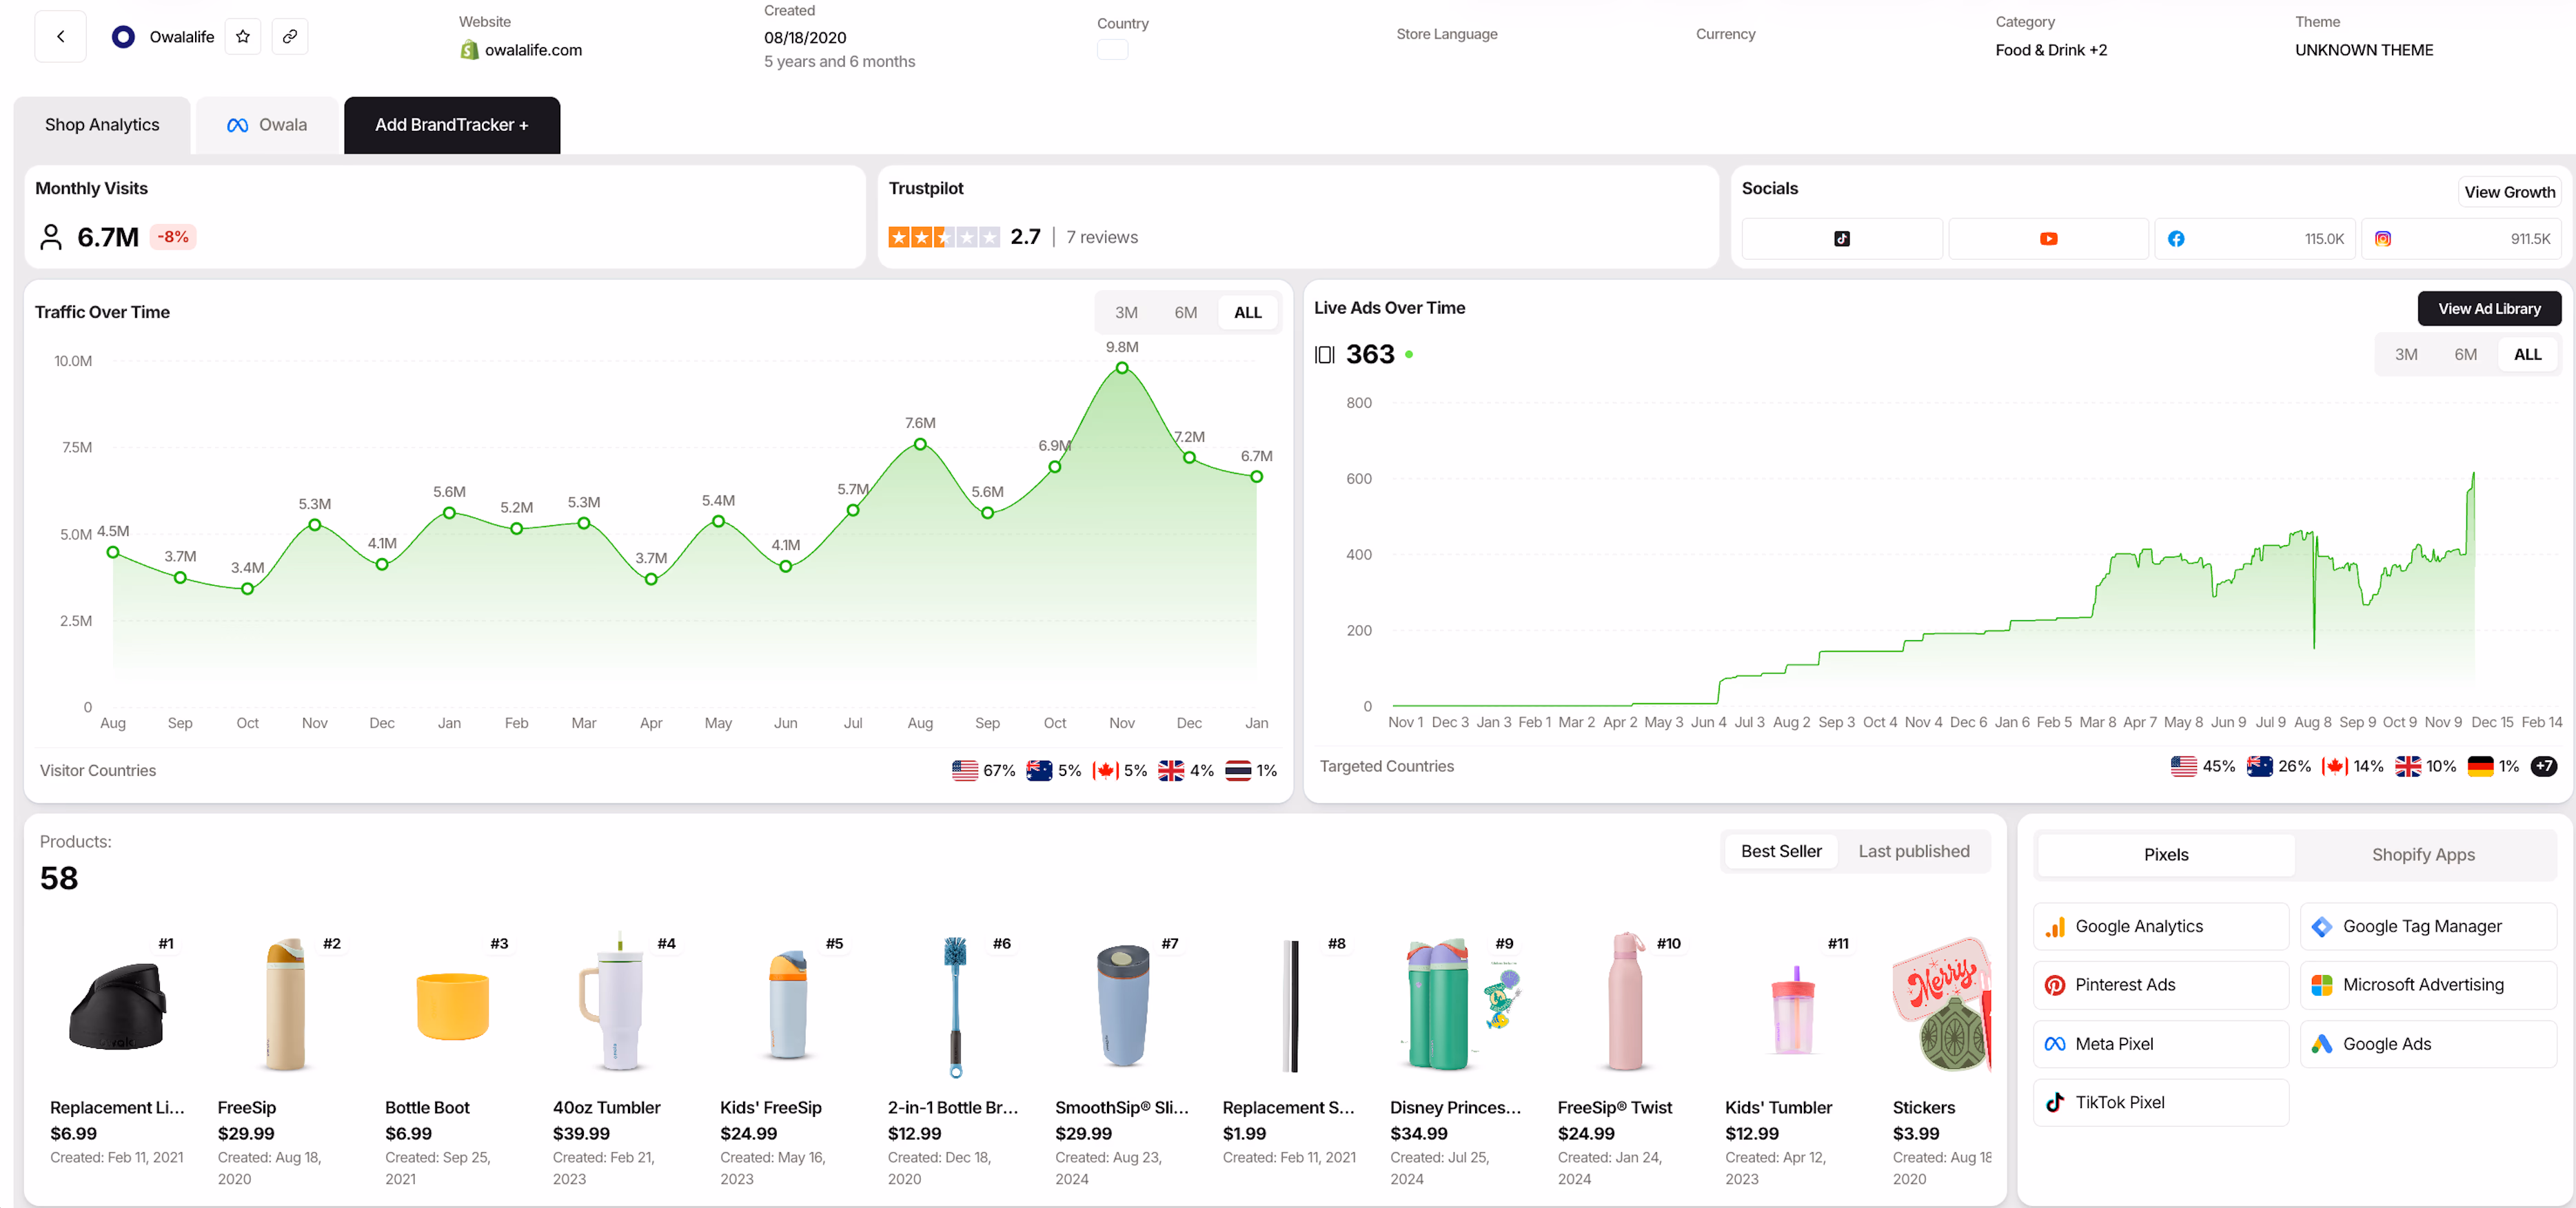
This balance demonstrates the power of fewer SKUs, clear merchandising, and less “decision clutter” for buyers.
A notable tension also appears. Despite massive attention, Owala has a Trustpilot score of 2.7. Whether temporary or structural, this reminds us that high traffic doesn't mean everything is perfect.
Competitive intelligence lets you isolate what works rather than copying a brand entirely. Learn how to spy on competitor ads to extract actionable insights.
What to benchmark in Trendtrack
If you use Trendtrack as a growth operator, Owala provides a clear benchmarking checklist. Start in Trending Shops and pull store-level baselines to compare with your own:
- Monthly visits: 6.7 million, with fluctuations reaching 9.8 million.
- Visitor country mix: 67% US traffic share. This indicates concentrated demand, not “global randomness.”
- Products: 58. A compact catalog simplifies mapping hero items and understanding promotion priorities.
- Social proof: 911.5K Instagram followers offer context when comparing traffic-to-social ratios across competitors.
Trendtrack’s filtering system saves time. You can filter Trending Shops by performance factors such as traffic levels, growth, ad counts, and ad growth. Then narrow down by shop attributes including product range, ecommerce tech, Shopify theme/apps, and pixels.
Filter business-level attributes like visitor country to find brands similar to Owala’s US-biased traffic mix. This ensures you compare relevant data without mixing unrelated cases.
7. 32 degrees
32 Degrees is often underestimated because it sells just basics. From a competitive intelligence perspective, it offers a clear example of how volume, pricing, and seasonal demand drive growth. Of course, if the acquisition system works well.

Why it is worth studying
The dashboard shows 5.7 million monthly visits, with a notable seasonal spike to 6.3 million visitors in December. This jump signals that their offer and media plan must be well-prepared for the holiday season. Study the best Black Friday ads to understand what works during peak seasons.
Their best-seller panel reveals aggressively accessible pricing, such as Men’s Cool Tees at $4.99. This strategy serves as a benchmark for apparel brands competing on value. When their traffic surges during the holidays, you can model how they position basics as easy add-to-cart items.
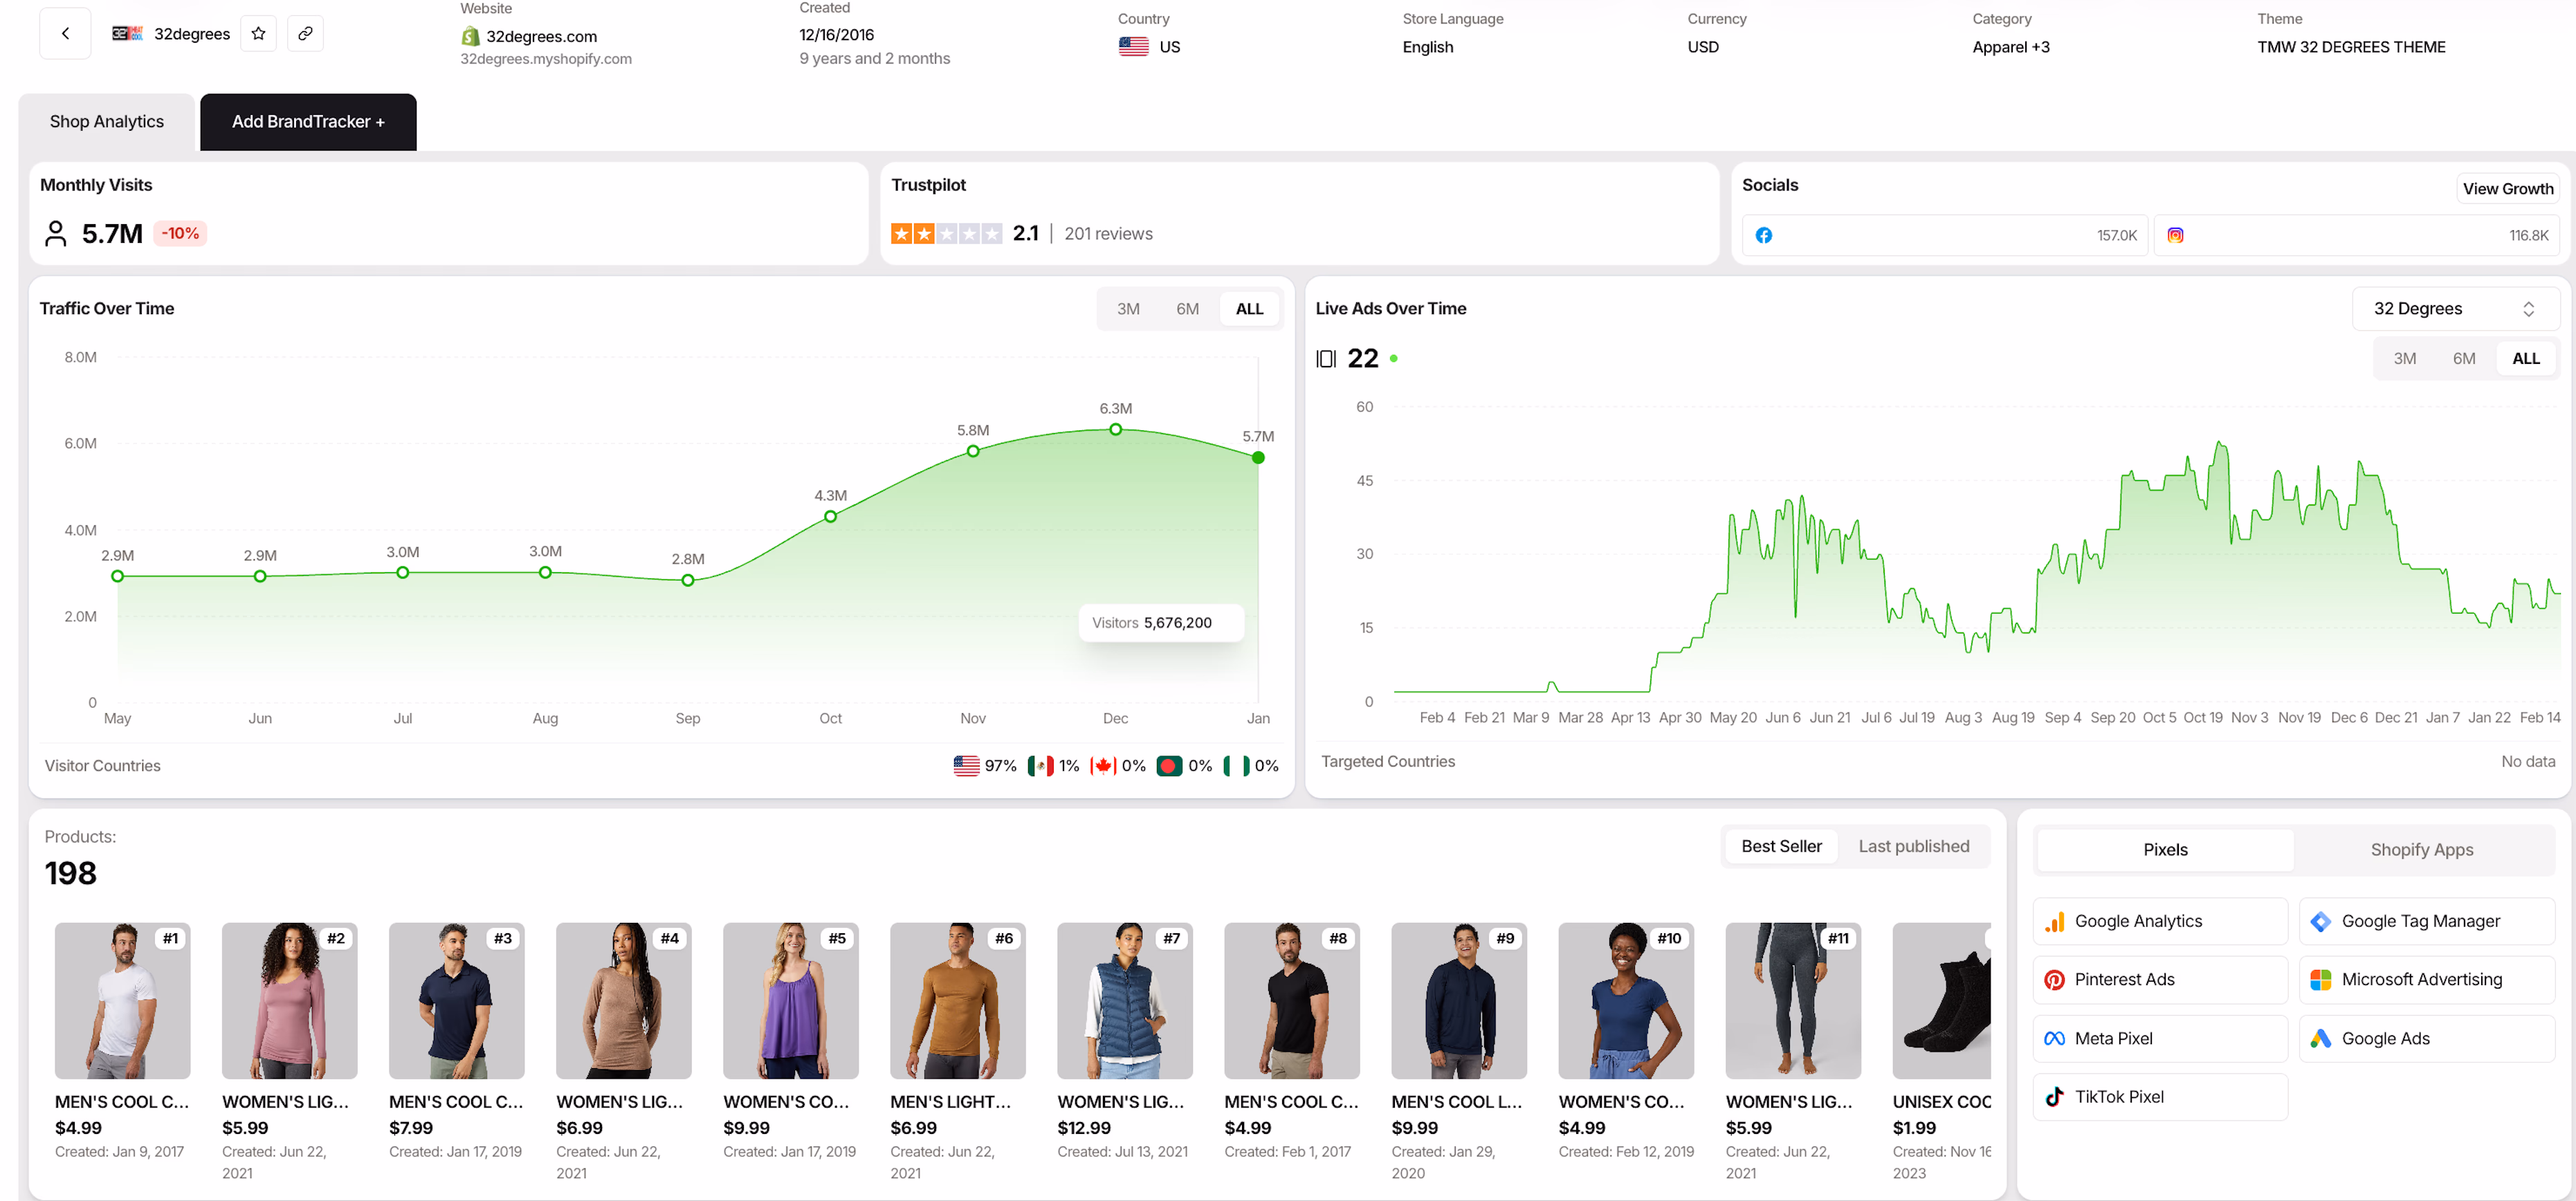
Despite strong traffic, the brand has a Trustpilot score of 2.1. This contrast highlights the difference between acquisition strength and customer experience quality. This is a thinng that you should consider when benchmarking competitors.
What to benchmark in Trendtrack
If you use Trendtrack to operate growth strategically, 32 Degrees offers key insights to analyze:
- Traffic over time: December peaks at 6.3 million visitors. Analyze what changes occur before December to understand this peak.
- Visitor geography: With 97% US traffic, use country filters to find comparable brands with similar geographic demand patterns.
- Pricing via best sellers: The $4.99 tee offers pricing reference. Monitor competitors selling basics at higher price points.
- Tracking pixels: The store uses Meta, Google Ads, and TikTok pixels, indicating multi-network marketing. Filter by pixel type to compare brands with similar marketing strategies.
- Theme impact: The store uses the "TMW 32 DEGREES THEME" on Shopify. Themes influence site speed, product pages, and conversions. Group shops by theme to identify common patterns.
View 32 Degrees as a case study in seasonal planning, value merchandising, and multi-channel measurement strategies.
8. Ring
Ring is one of those brands that many people think they understand, until you examine the numbers and international setup closely.
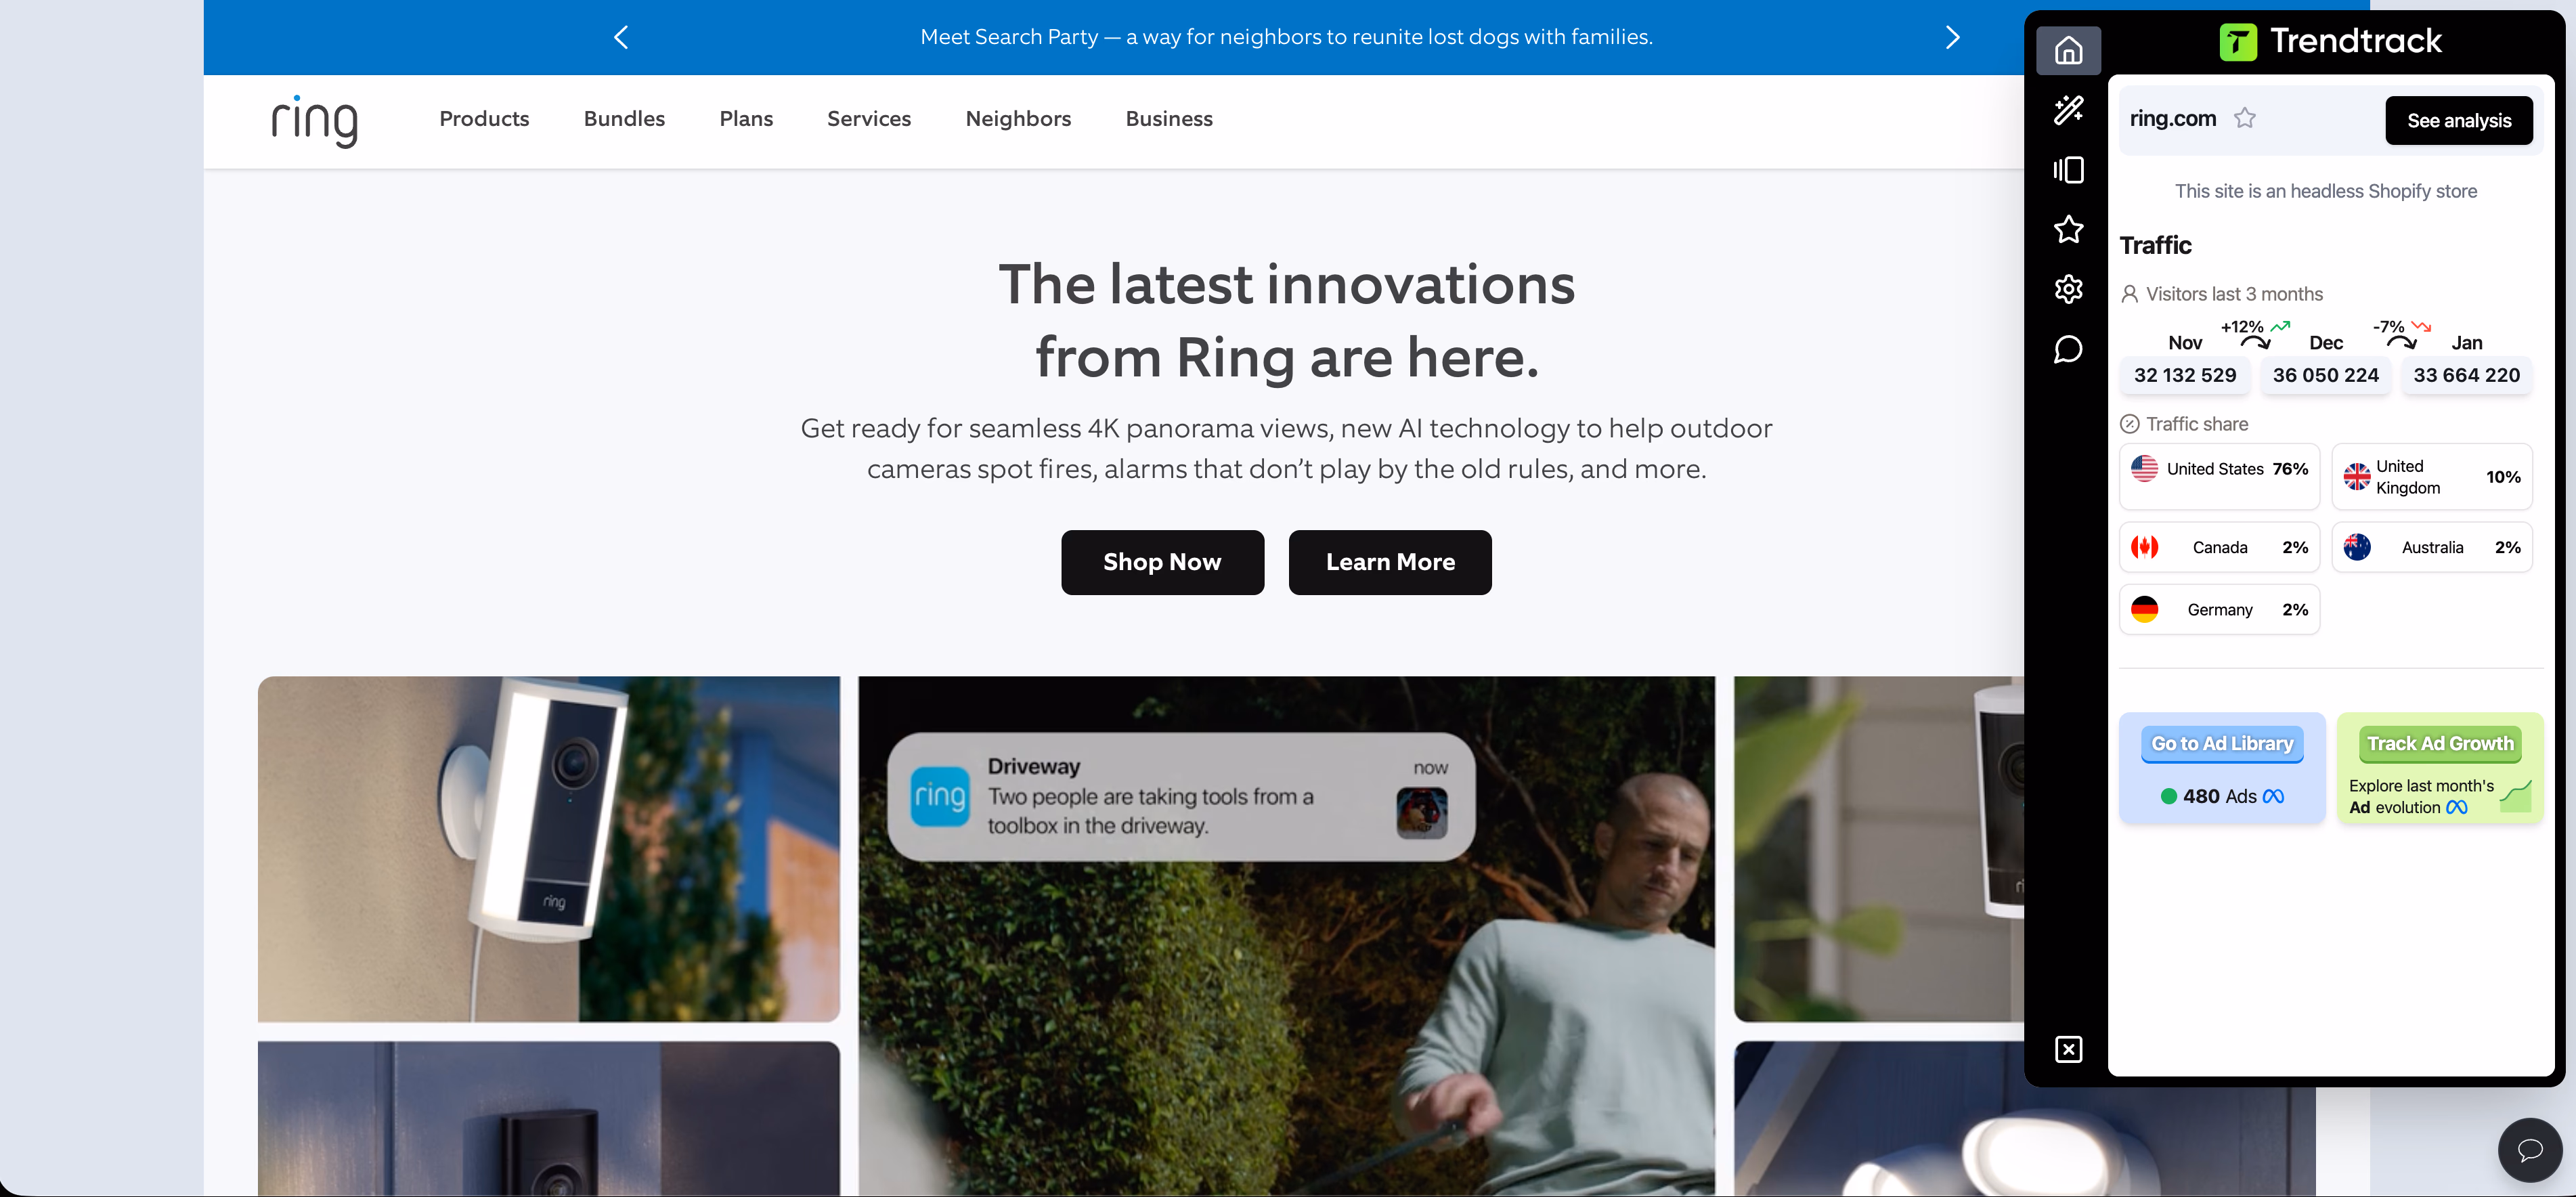
Why it is worth studying
The most valuable insight from Ring isn’t about their product. It lies in their operational footprint, which you can reverse-engineer.
The dashboard shows 33.7 million monthly visits. This is not just a result of a few viral ads; it reflects sustained demand. The store's setup includes Spanish language and localized pricing and products. You can see product titles in Spanish and prices in Mexican pesos.
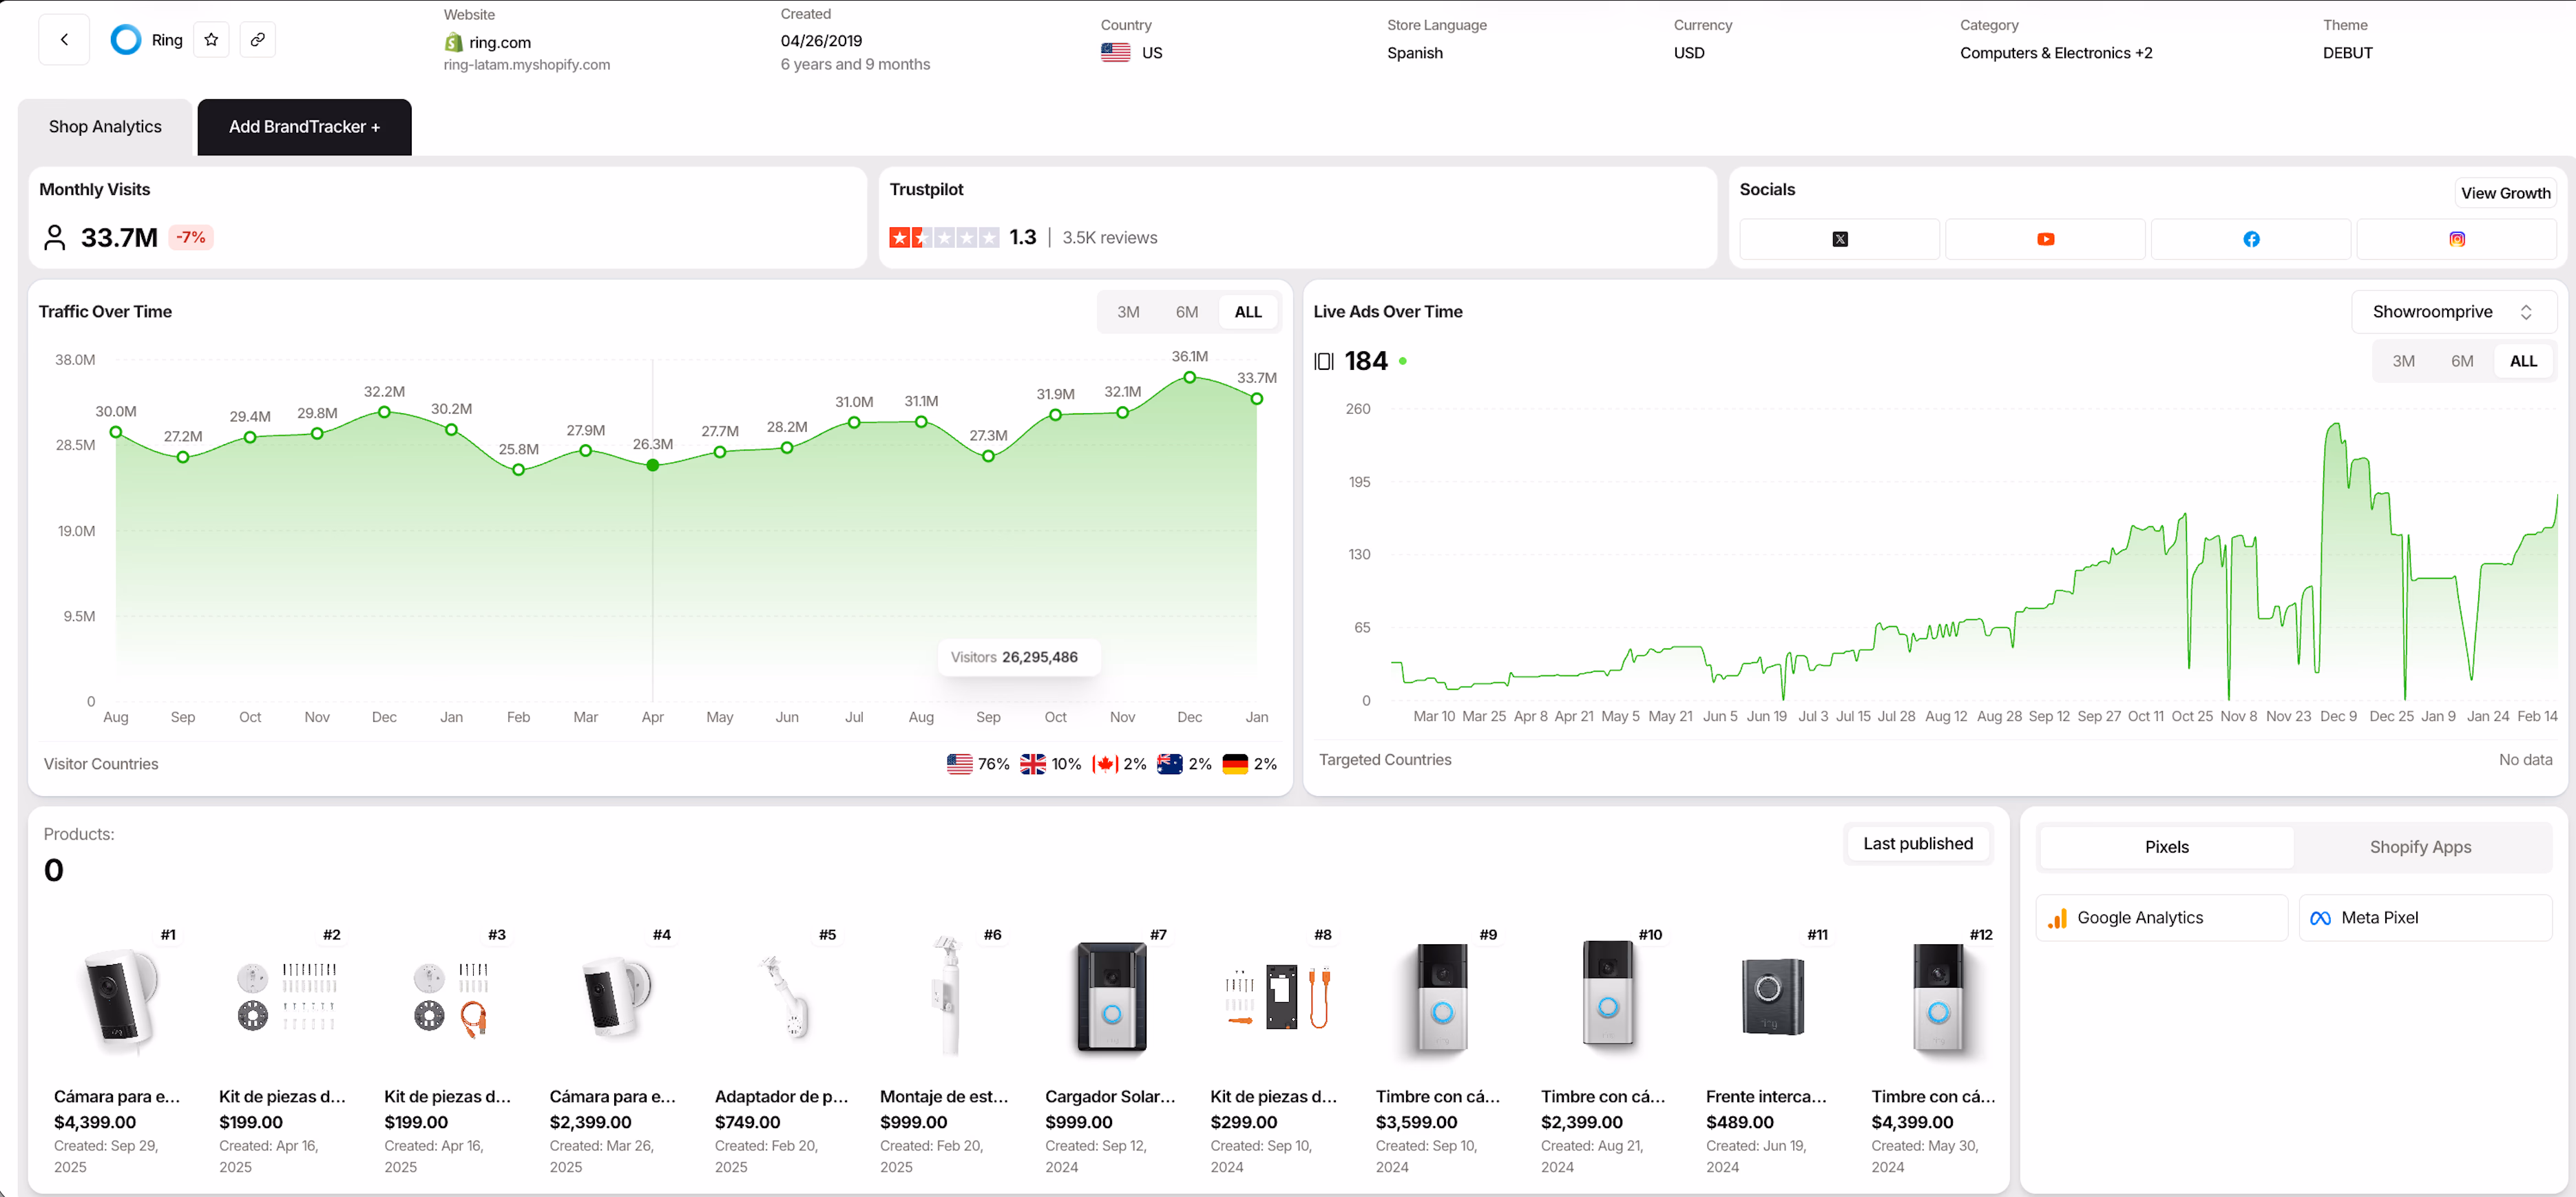
Yet, the store is US-based and targets multiple markets, including the UK and Germany. This provides a clear example of multi-market ecommerce where the store itself carries much of the workload. Not just the advertising.
What to benchmark in Trendtrack
If you want to learn from Ring using Trendtrack rather than just admire the brand, focus on answering. Where does their scale come from, market coverage, product range, advertising intensity, or infrastructure? A thorough benchmarking approach involves:
- Check monthly visits under Trending shops and segment by visitor country to assess if demand is concentrated or multi-market. Ring's Spanish and international targeting suggests multi-country reach.
- Apply shop filters to understand store mechanics. Ring uses Shopify theme DEBUT (created April 2019), indicating an established store with years of growth, not a new benchmark.
- Inspect Trendtrack "plumbing": review pixels, Shopify theme, apps, and language/currency settings. Map infrastructure choices to observed scale rather than copying aesthetics.
9. Decathlon
Decathlon is a competitor worth focusing on because of its huge catalog, steady demand, and operational discipline.

The brand consistently turns outdoor basics like jackets, backpacks, and hiking gear into reliable revenue. If you’re building a category store, this Shopify example offers valuable lessons on structure, not just products.
Why it is worth studying
This Trendtrack snapshot reveals why Decathlon stands out beyond sports stores. Their US store attracts around 7.7 million monthly visits with peaks reaching 8 million. This volume suggests any changes to navigation, merchandising, or landing page structure have likely been tested extensively.
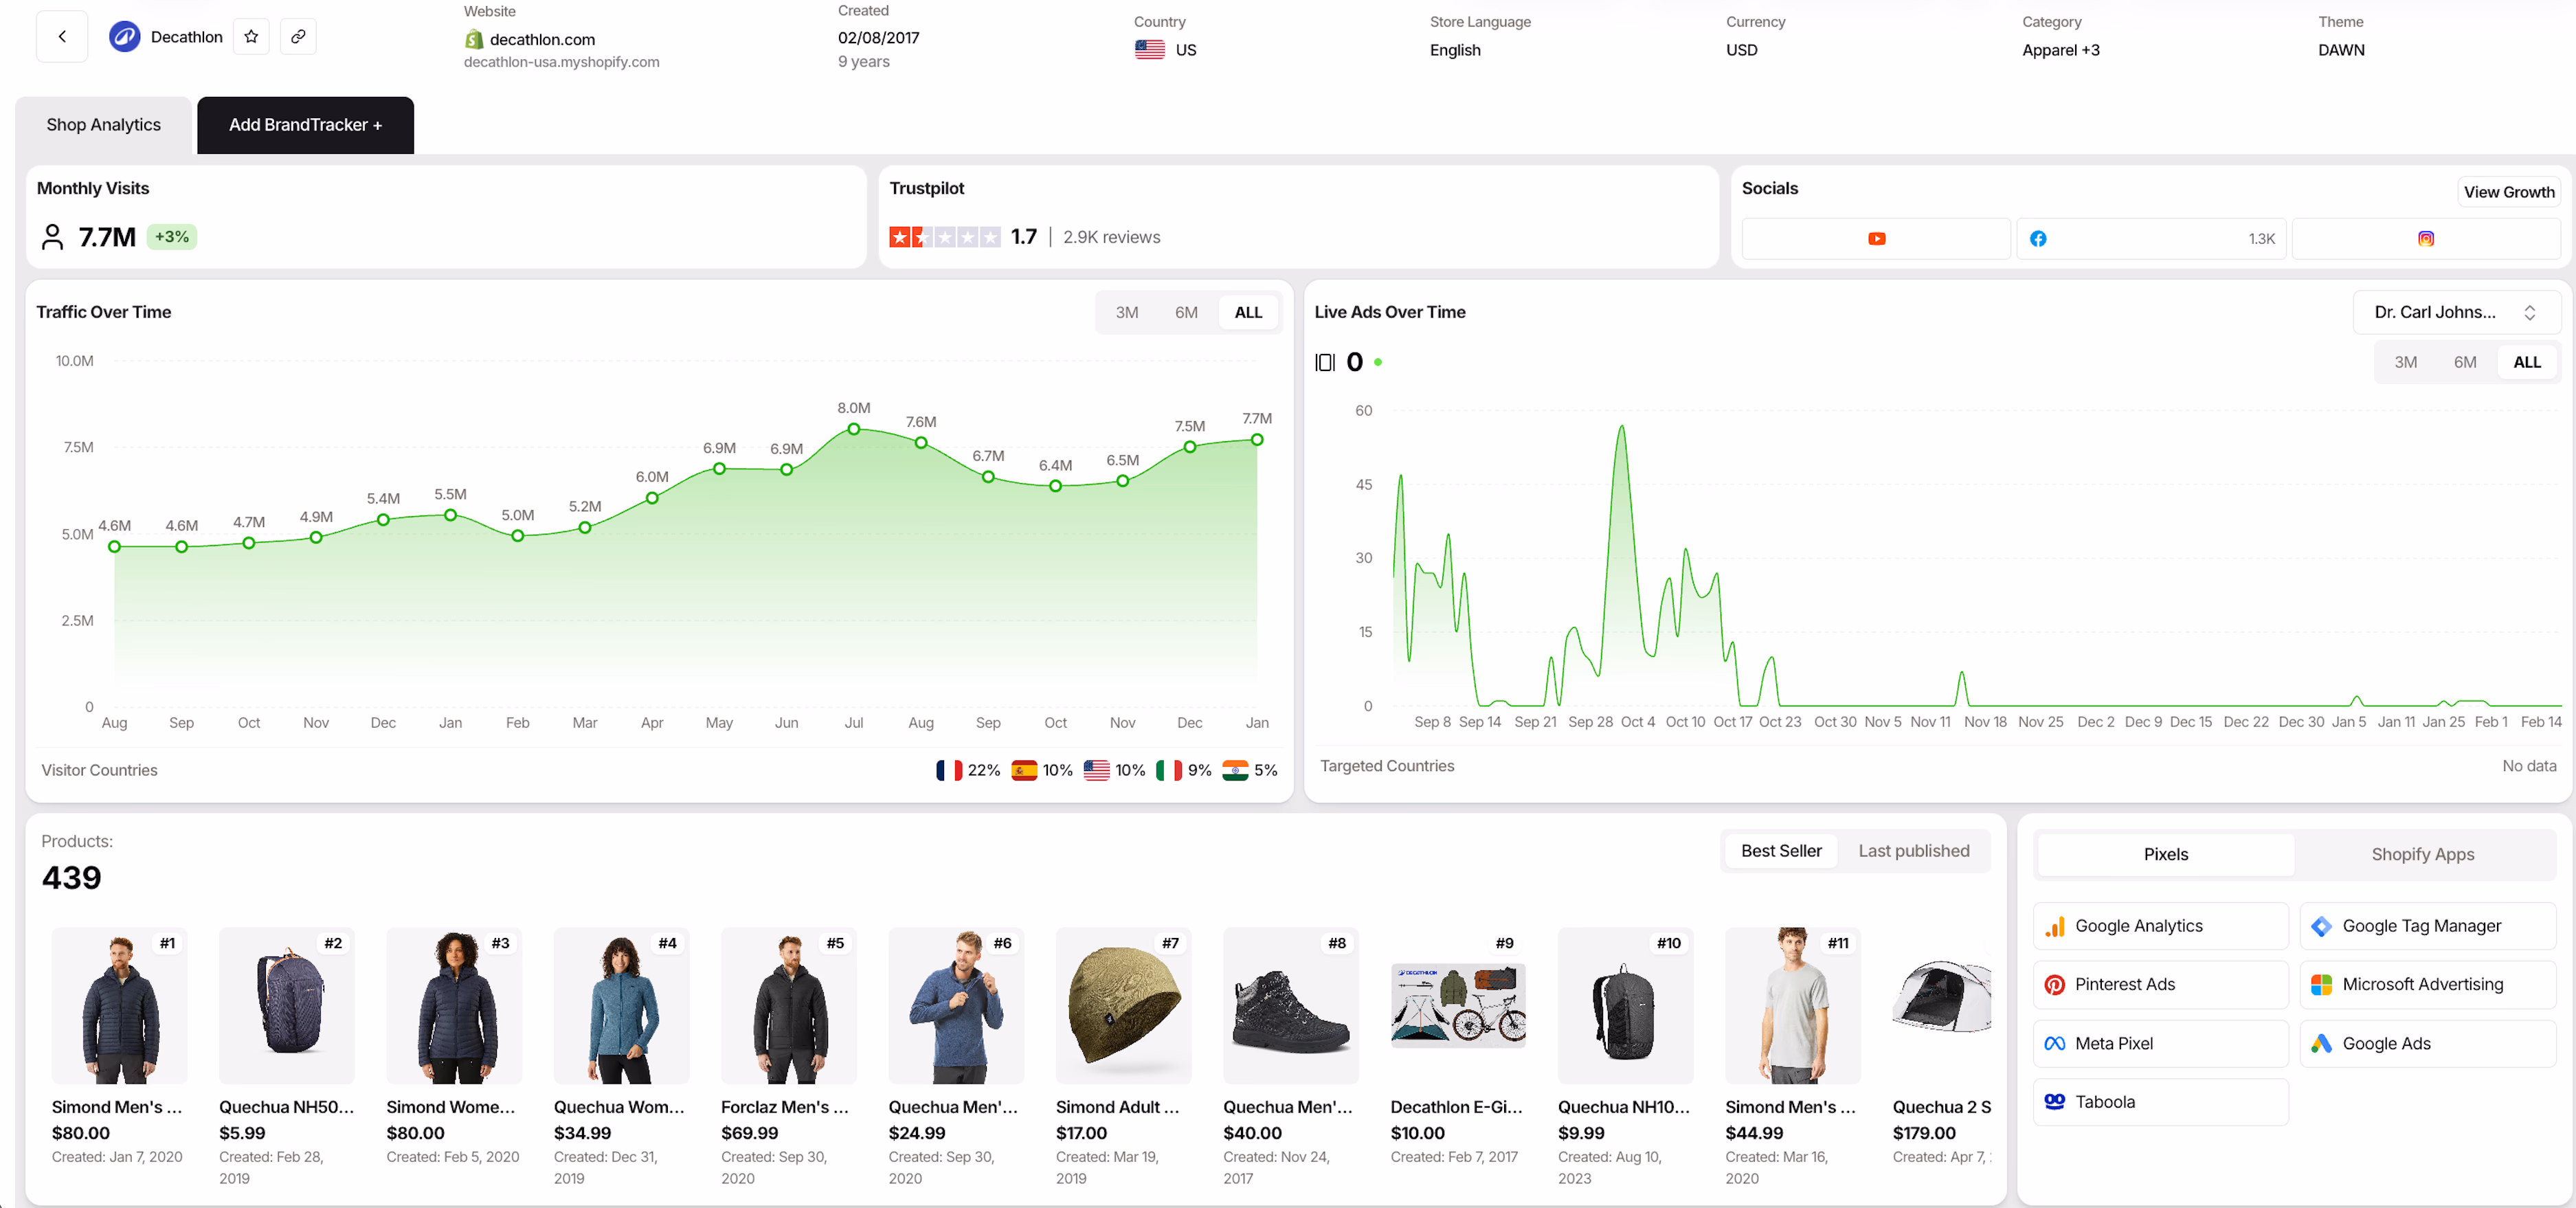
A detail often overlooked is that the store uses DAWN, a clean and fast Shopify theme. This shows that strong performance often depends on clarity and speed, not on exotic themes.
What to benchmark in Trendtrack
If you use Trendtrack as a real operator, Decathlon offers a clear checklist for benchmarking:
- Look at traffic baseline and peaks: Start with the 7.7 million monthly visits and study spikes on the traffic chart. Ask: what products or categories were promoted when traffic surged? Popular outdoor items like Simond Men’s and Quechua NH50 are good starting points for merchandising insights.
- Observe tech stack signals you can copy: The screenshot displays pixels from Google, Meta, Pinterest, and Taboola. This indicates their acquisition strategy is diversified across channels. Learn how to track competitor ad spend to understand their full marketing mix.
- Check store maturity: The store's creation date is February 2017. Mature stores usually have clearer category structures, stable best-sellers, and fewer random experiments. This helps you identify replicable patterns.
{{cta-1}}
10. Steve Madden
Steve Madden is a Shopify store to study when you want to see ecommerce at scale. It features a big catalog, clear seasonal changes, and enough tracking and ads infrastructure to keep a media team busy all week.
Why it is worth studying
Most store breakdowns overlook the messy reality:. once you reach millions of visits, a good homepage alone no longer drives success. The real challenge becomes orchestrating merchandising, traffic shaping, and ad volume together.
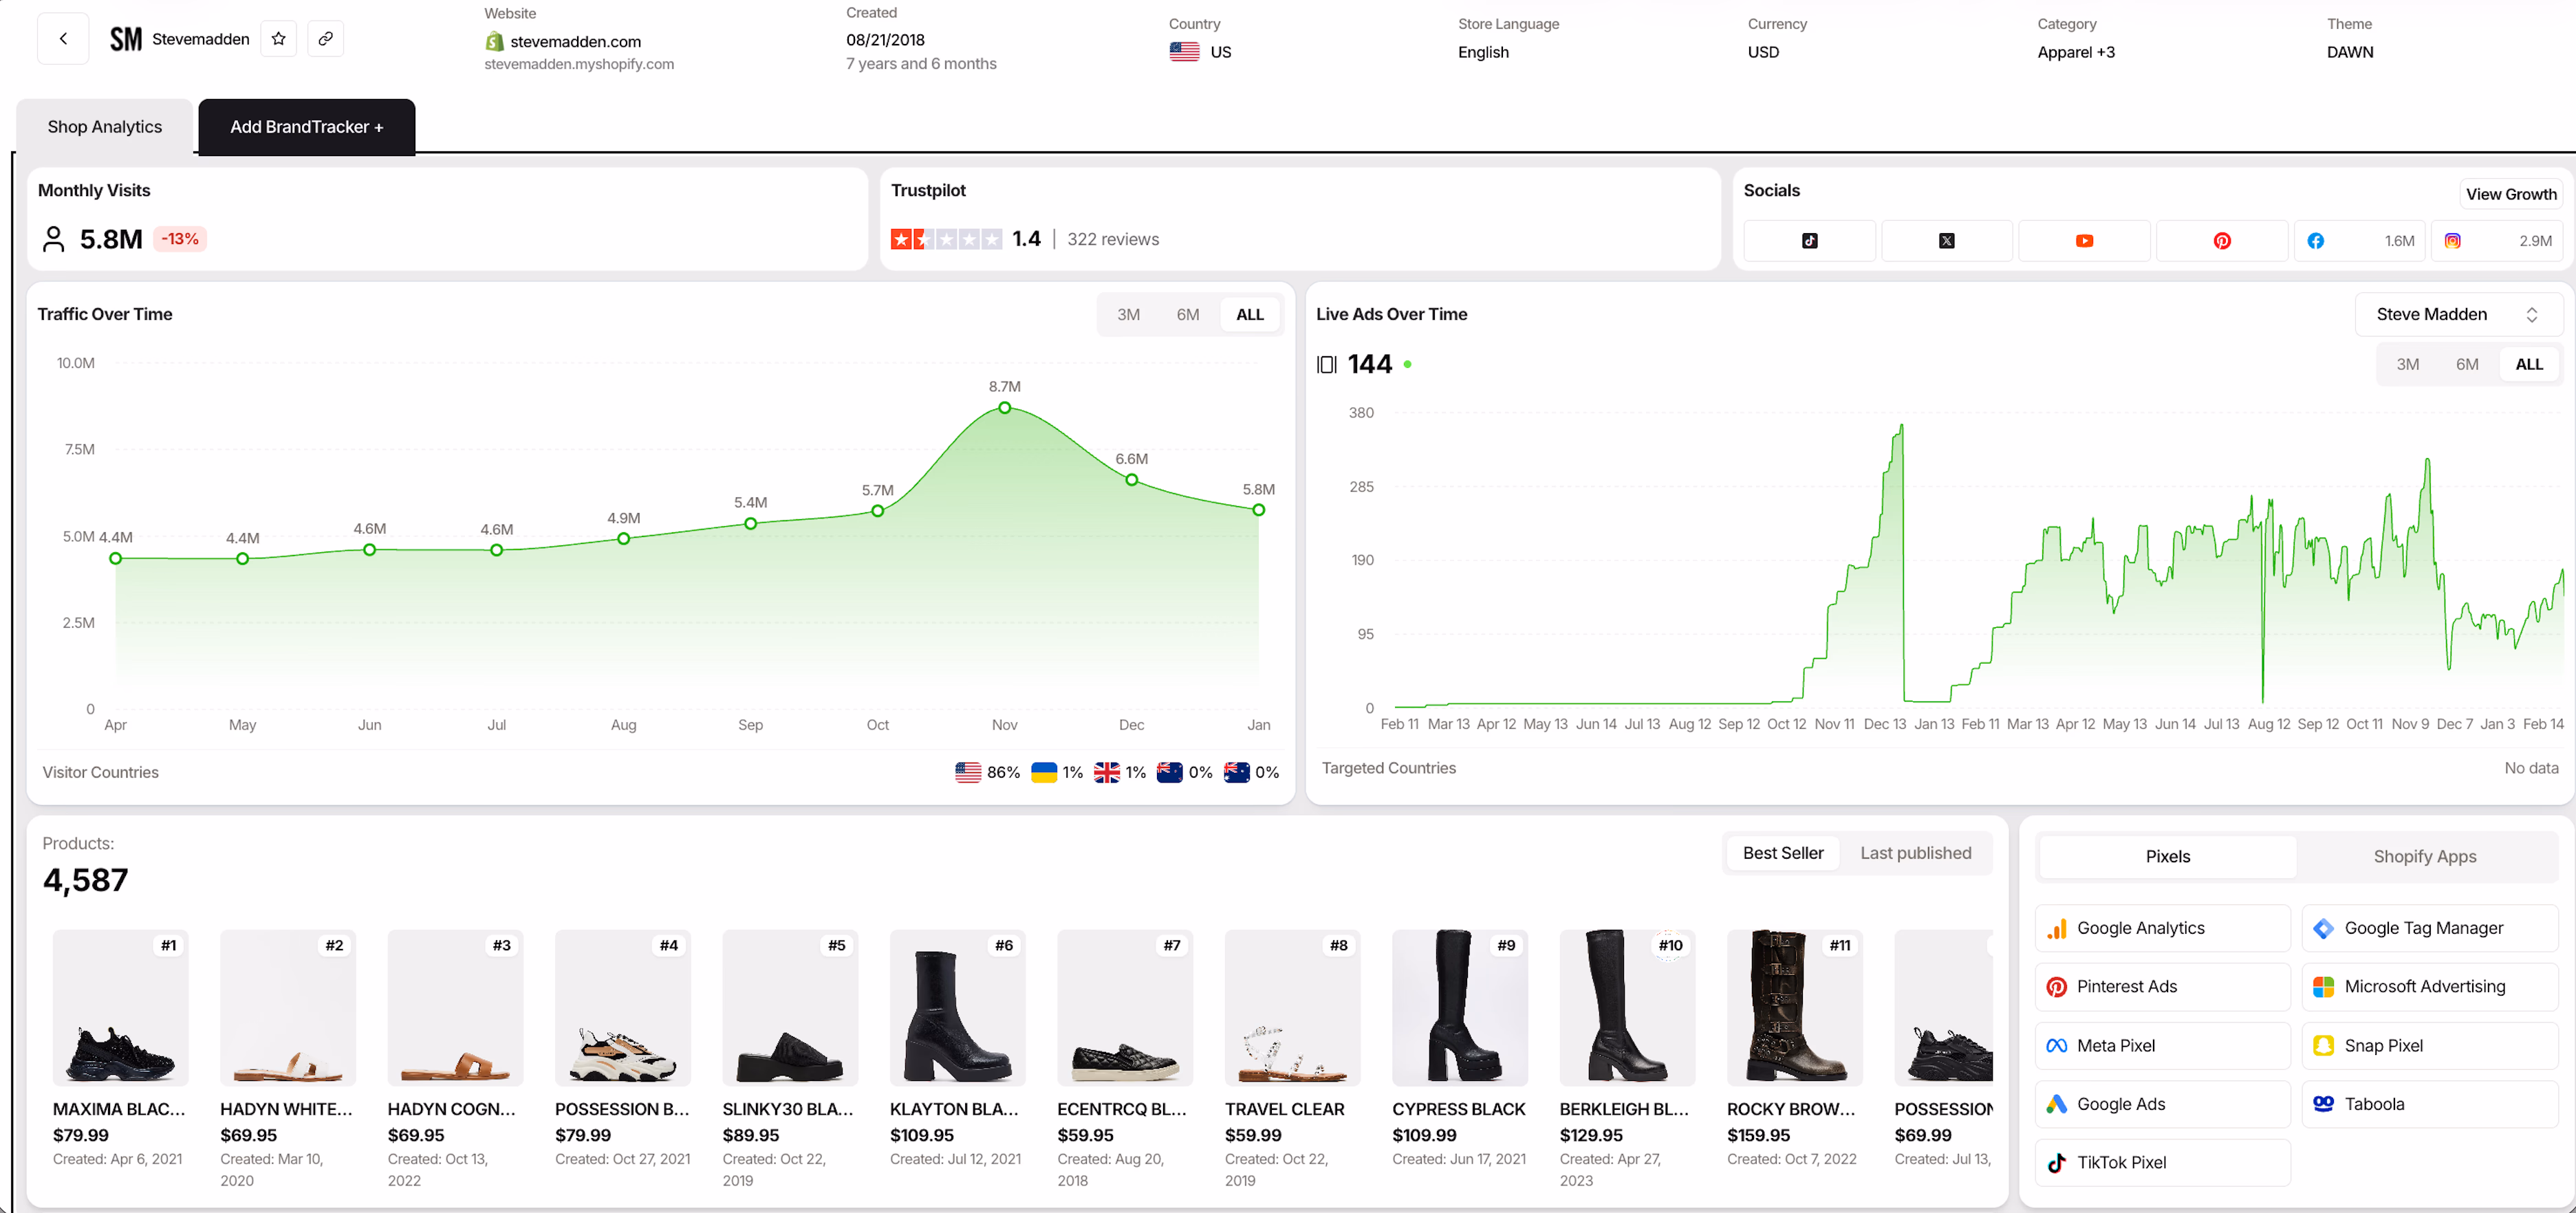
From the Trendtrack dashboard, Steve Madden shows several clear signals:
- It’s not steady. There is a visible spike to 8.7 million visits in November, indicating strong seasonality and a real promotional calendar.
- It operates a massive catalog. With 4,587 items, requiring different strategies for navigation, search, collections, and advertising.
- It runs a meaningful ad program with 144 live ads. Not too many, not too few. This middle ground often belongs to mature brands: enough creative to cover segments without chaos.
What to benchmark in Trendtrack
Use Trendtrack to learn from Steve Madden by focusing on clear, measurable benchmarks. Key points include:
- Analyze traffic patterns: Analyze 7.7 million monthly visits to identify products and categories driving traffic spikes
- Review tech stack signals: The store uses pixels from Google, Meta, Pinterest, and Taboola. This shows a diversified acquisition strategy across channels. Use tools to search Facebook ads and analyze competitors' marketing mixes.
- Assess store maturity: Created in February 2017, mature stores typically have organized categories and fewer experiments. This helps you identify replicable patterns.
Use Trendtrack to validate ideas without guessing. Compare your traffic patterns to their seasonality. Check if your catalog size helps or hurts, and see if your tracking setup is strong enough to optimize.
Conclusion
Most "example Shopify stores" listicles focus on aesthetics, not performance. Growth managers need a way to explain why stores perform well and identify signals worth copying.
Treat these brands as datasets by analyzing traffic momentum, demand by country, catalog strategy, and ad velocity. This helps you validate ideas without guessing and avoid copying creatives that only succeed due to timing.
Use this approach:
- Examine store reality: review demand over time, traffic sources, and whether growth is broad or focused.
- Analyze the demand system: monitor ad activity and creative shifts to see if brands scale one angle or test many.
- Connect ads to execution: verify landing pages and merchandising match repeated offers.
Build a competitive watchlist and review it daily for ads and weekly for store changes. Use these stores as a baseline, then apply data-driven validation before committing budget. This approach lets you launch with confidence even in crowded categories.


.avif)
Ready to build a millions dollars brand ?
.avif)
