How to Track Competitor Ad Spend Across Channels


Think competitor ad spend is locked behind expensive tools? Think again.
You can access actual spend data for free in the EU and UK through Meta's Ads Library and Google's Transparency Center. Outside these regions? We'll show you how to make educated estimates that get you within 20-30% accuracy.
Discover which method works for your region and how to turn competitor insights into your own winning media strategy.
Quick Ways to Check Competitor Ad Spend
The fastest way to check competitor ad spend depends on where your competitors advertise:
For EU & UK Markets (Direct Data Available):
- Meta Ads Library – Shows actual spend ranges ($100-$500, $1K-$5K, etc.) for all ads delivered to EU/UK users. Free and accessible to anyone.
- Google Ads Transparency Center – Provides spend data for political ads globally, plus all commercial ads shown in the EU.
- Trendtrack filters ads by actual spend in supported regions, showing campaigns spending with demographic details.
For All Other Markets (Estimation Required):
- Free tools: Meta Ads Library (no spend, but shows ad longevity and volume), TikTok Creative Center, manual retargeting paths
- Paid platforms: Trendtrack, Semrush (AdClarity), which provide impression estimates, traffic data, and spend proxies
- Manual triangulation: Combine ad count × longevity × traffic surges × niche CPM/CPC benchmarks"
What competitor ad spend really means
Raw budget numbers alone don’t reveal much. Big spend often reflects testing, not efficient returns. Focus on actionable signals like:
- Volume: how many ads are live
- Longevity: ads running 30+ days suggest profit
- Timing: coordinated surges or seasonal ramps
If one campaign delivers 40% of impressions using few creatives, that shows a high-budget, heavily optimized effort.
Instead of chasing “winning product” lists, map patterns to see who leans on video, batches offers, or rides seasonality. Decode these trends to learn from the biggest direct-to-consumer (DTC) brands.
A 10-minute checklist to benchmark a competitor’s ad budget today
- Choose one competitor and their main sales channel. Let's say it is Alo Yoga.
- Search them in Trendtrack and scan weekly/monthly ad peaks, traffic growth, and active ad counts. Watch for sudden jumps.
- Open their live ad galleries from Trendtrack. Count campaigns, variants, and days running.

- Estimate weekly impressions per channel using platform filters. Combine this with your CPM/CPC benchmarks to approximate spend.
- Flag ads running 30+ days and copied across many variants. These indicate heavy optimization and significant budget.

- Cross-reference SEMrush or AdClarity for search/display spend estimates and traffic-cost metrics.
- Watch for seasonal spikes (Q4, Black Friday, January) and note early budget increases.
- Record everything in your media plan sheet. Map channel mix and validate creative strategy.
Confirm your ideas with data, then act. This process lets you out-test and outspend competitors confidently.
Other Methods to Estimate Competitor Ad Spend by Channel
Meta, Google, and TikTok also provide data to reverse-engineer budgets, validate ideas, and plan more effectively. Below are practical, free methods that deliver results.
Meta Ads Library: Get beyond basic spying
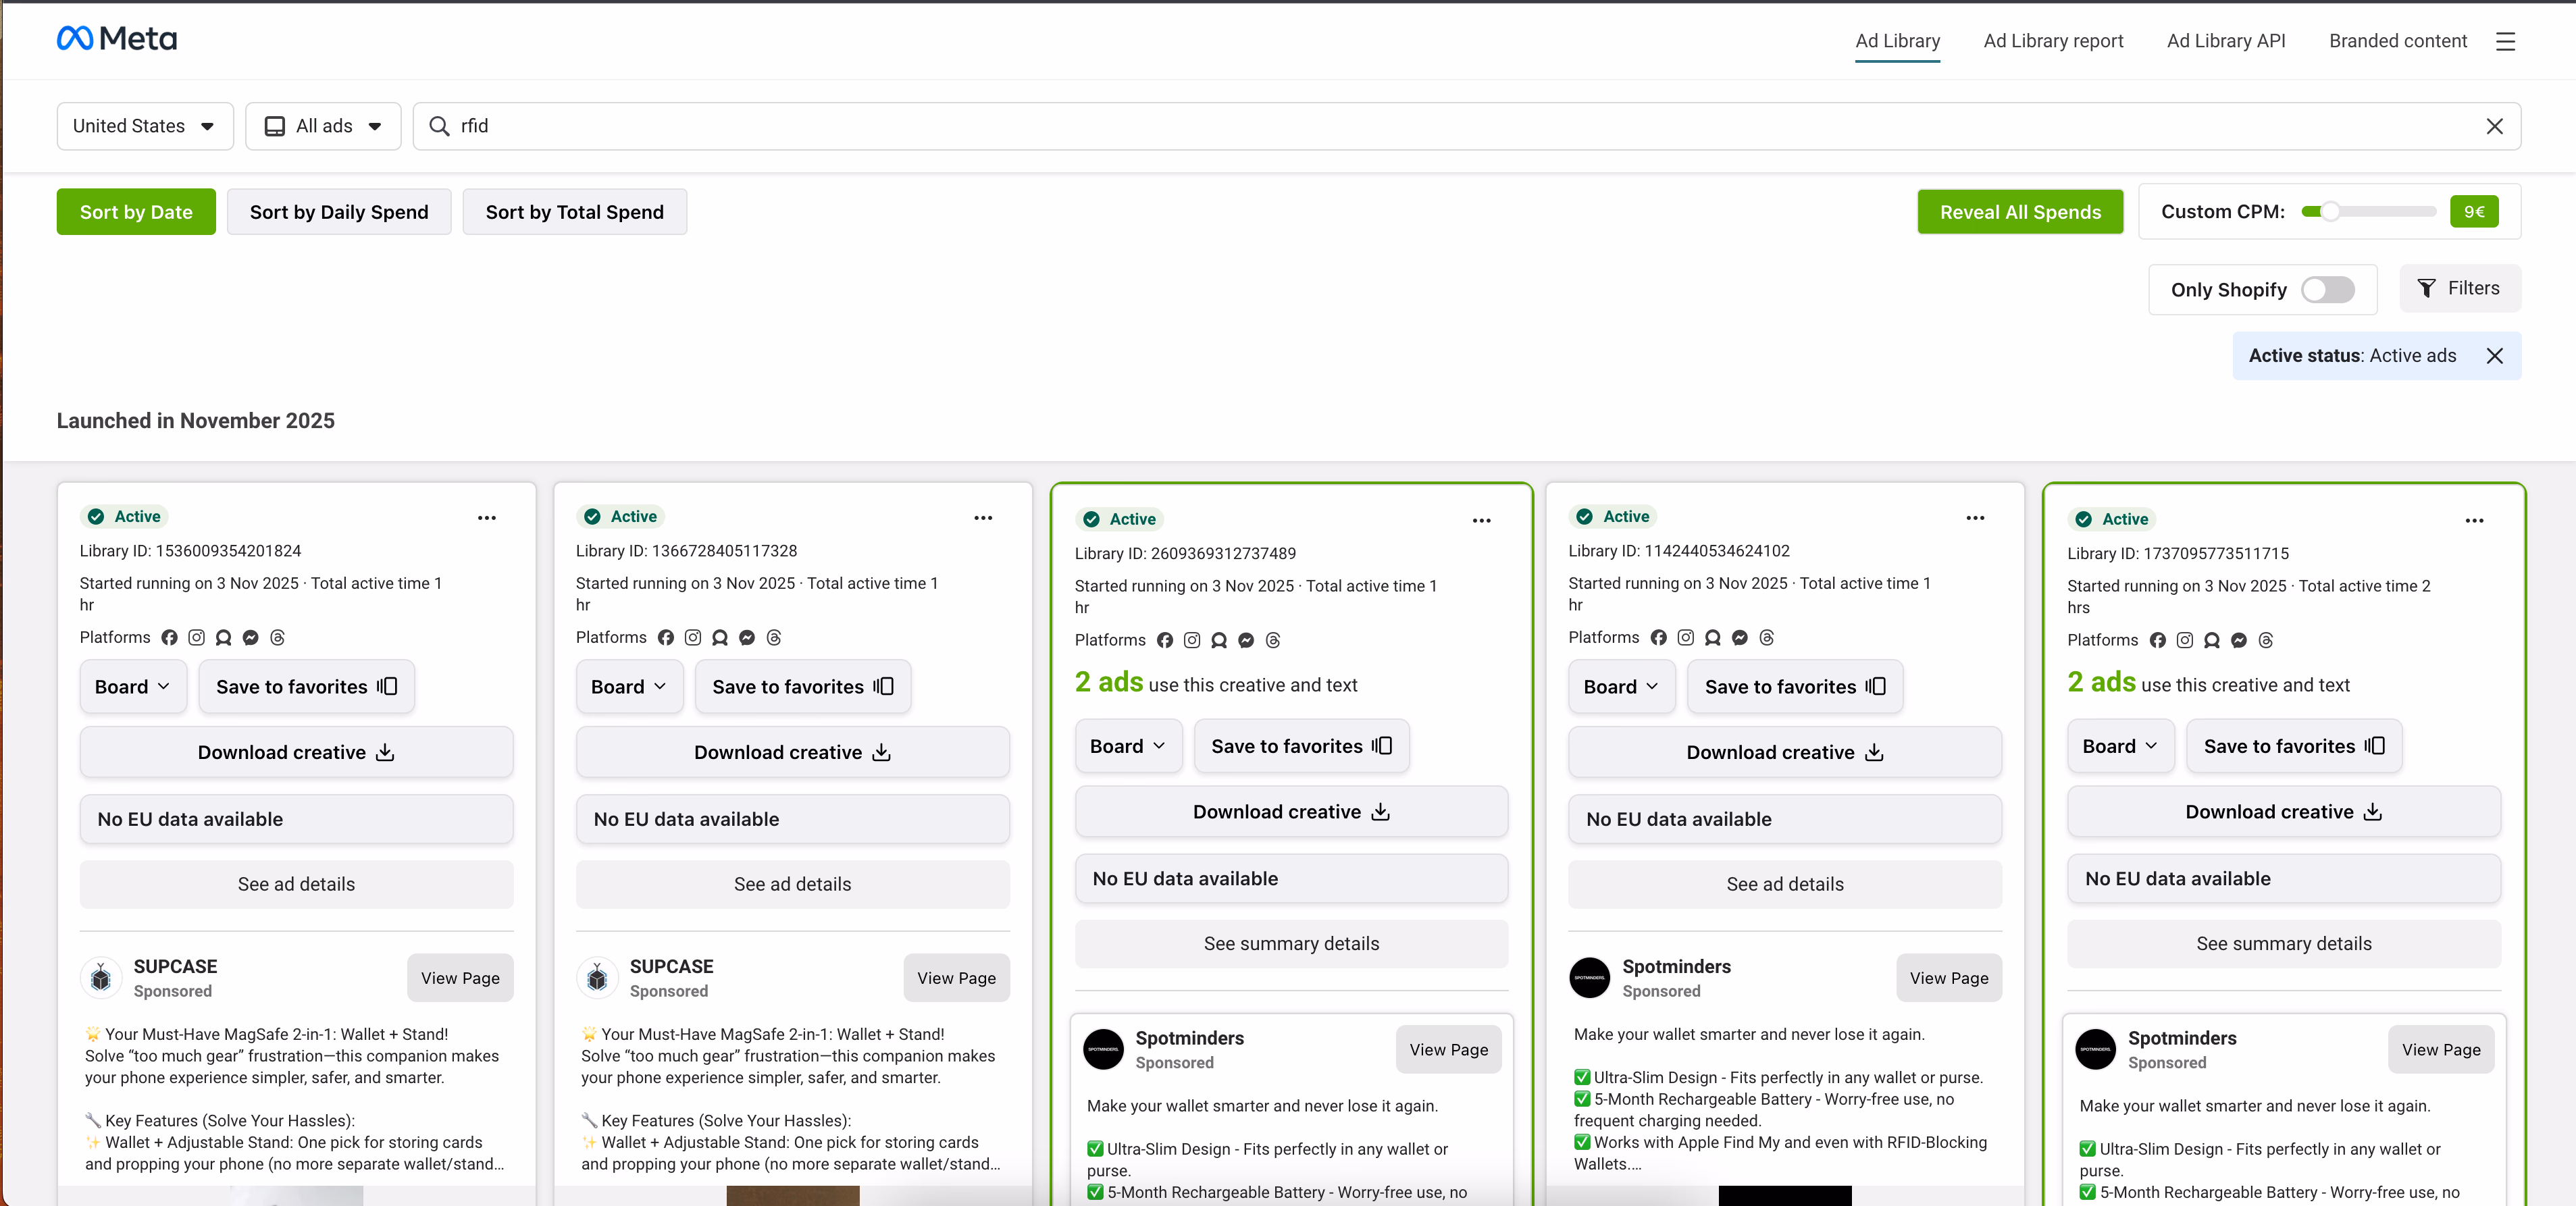
For EU & UK advertisers: Meta Ads Library is your gold mine for actual spend data.
Search any competitor and you'll see:
- Spend brackets from $100 to $50k
- Exact start and end dates
- Impressions (in ranges)
- Demographic breakdown by age and gender
This data is completely free and accessible to anyone, no tools required.
For advertisers outside EU/UK, you won't see spend figures, but you can still infer budget from these signals.
If a DTC brand launches 20 ads in three weeks and later reduces to five “survivors,” this shows a live test-to-scale process.
Capture screenshots of creatives, note landing pages, and log patterns. Concentrate on these signals instead of chasing single “winning” ads to learn from top DTC advertisers.
Want to dig deeper into Meta's ad data? Learn how to search Facebook ads to uncover competitor creative patterns and refine your own testing strategy.
Google Ads Transparency Center

Google's Ads Transparency Center takes a different approach than Meta.
In Google’s Ads Transparency Center, users can see a range of details about each campaign. For political ads, Google discloses estimated spending brackets such as $0–$100, $100–$500, or $1K–$5K. This gives a sense of budget levels without showing exact figures.
Due to EU transparency regulations, all ads served to EU audiences are also listed with their corresponding spend data.
Each advertiser’s verification status is visible, along with information about ad formats. The Transparency Center also shows the specific dates when ads were active.
Additionally, users can explore where the ads were shown through geographic targeting data. In some cases, they can also view limited demographic insights about the audience reached.
What you CAN'T see:
- Spend for commercial (non-political) ads outside the EU
- Real-time data, ads appear 48-72 hours after first display
How to use it for spend estimation:
To estimate ad spend using Google’s Ads Transparency tools, marketers can combine library data with manual monitoring. Start by checking which advertisers consistently appear on key category search terms. Persistent visibility usually signals a strong and sustained search budget.
Tracking ad volume over time also helps identify seasonal spending spikes, such as around product launches or major sales periods.
For EU-based advertisers, filtering results by region can reveal actual spend brackets on Display and YouTube ads. Google discloses this information under EU transparency rules.
To refine estimates further, complement this data with weekly manual searches of brand and product keywords on Google. Consistent or increasing ad presence in these results typically indicates higher bidding activity and rising budgets.
TikTok Creative Center

TikTok’s Creative Center does not currently display ad spend data for the UK or EU.
TikTok launched a Commercial Content Library covering ads shown across the European Economic Area, the UK, and Switzerland. However, the available information focuses on creative metadata. Such as ad visuals, run dates, targeting parameters (like age and gender), and estimated audience reach.
The library complies with EU transparency requirements under the Digital Services Act. However, it does not reveal specific spending amounts or budget ranges for each campaign.
As a result, advertisers and analysts can assess engagement trends and creative patterns. However, they cannot see the financial scale of campaigns in these regions.
For deeper TikTok campaign analysis, explore these TikTok AdSpy tools and methods.
Manual Website Visits and Retargeting
Walk through the competitor’s funnel yourself. Browse product pages, add items to the cart, then abandon the session. Clear cookies or use different devices to trigger retargeting ads on Facebook, Instagram, and Google.
Frequent retargeting suggests sizable funnel budgets. This method confirms spend signals through actual customer interactions. Conduct structured tests and record the funnel flow rather than casually scrolling.
Social Listening and Seasonal Promo Reconnaissance
Use dummy accounts to follow competitors, engage with posts, and let the algorithm surface sponsored content. Read comments for insights on campaign impact. Note promo timing and creative shifts during holidays.
Bookmark and track these spikes. They often align with major media plans.
This approach provides data-backed insights, replacing guesswork. When ready to automate, platforms like Trendtrack convert these manual checks into effortless intelligence.
Build a Simple Competitor Ad Spend Estimator
Get ahead of your competitors using a practical spreadsheet method. Validate your ideas without guessing and set campaign budgets with real-world data. This approach requires no complex software, just visible campaign signals and straightforward math.

Gather inputs: impressions, CPC/CPM benchmarks, channel mix, and frequency
You're tracking a DTC skincare competitor. You gather:
- Semrush shows ~39,000 monthly PPC visits
- Category average CPC = $3.20
- Meta Ads Library shows 47 active ads, most running 20+ days
- SimilarWeb estimates 450K monthly social visitors
- Your niche CPM benchmark = $8
These are your inputs for the next step.
Model PPC via share of voice and CPC, and social/video via CPM and impressions
To estimate monthly ad spend, apply simple math to available traffic and cost data. For PPC, 39,000 clicks at an average cost-per-click of $3.20 equals roughly $124,800 per month.
On social, if 30% of total traffic (about 135,000 visits) comes from paid sources and the average landing page converts at 2%, the advertiser would need around 6.75 million impressions.
At a $8 CPM, this results in approximately $54,000 in monthly social spend. Combined, the brand’s total estimated ad budget would be around $179,000 per month.
Now validate this with other signals. Are their ads running 30+ days? (Yes → profitable spend). Do they have 10+ ad duplicates? (Yes → scaling budget). Does their traffic correlate with ad volume spikes? (Yes → estimation is directionally accurate).
Validate estimates with multiple sources and define error ranges
Avoid relying on a single data source by triangulating your inputs. Reality check for our example:
- Cross-check with AdClarity impression data—do the numbers align?
- Check if $179K monthly spend makes sense for their category
- Apply ±25% error margin: actual spend likely between $134K-$224K
- Monitor for 2-3 months to see if spend is consistent or seasonal"
Map spend to ROAS, POAS, CPA, and payback using a break-even model
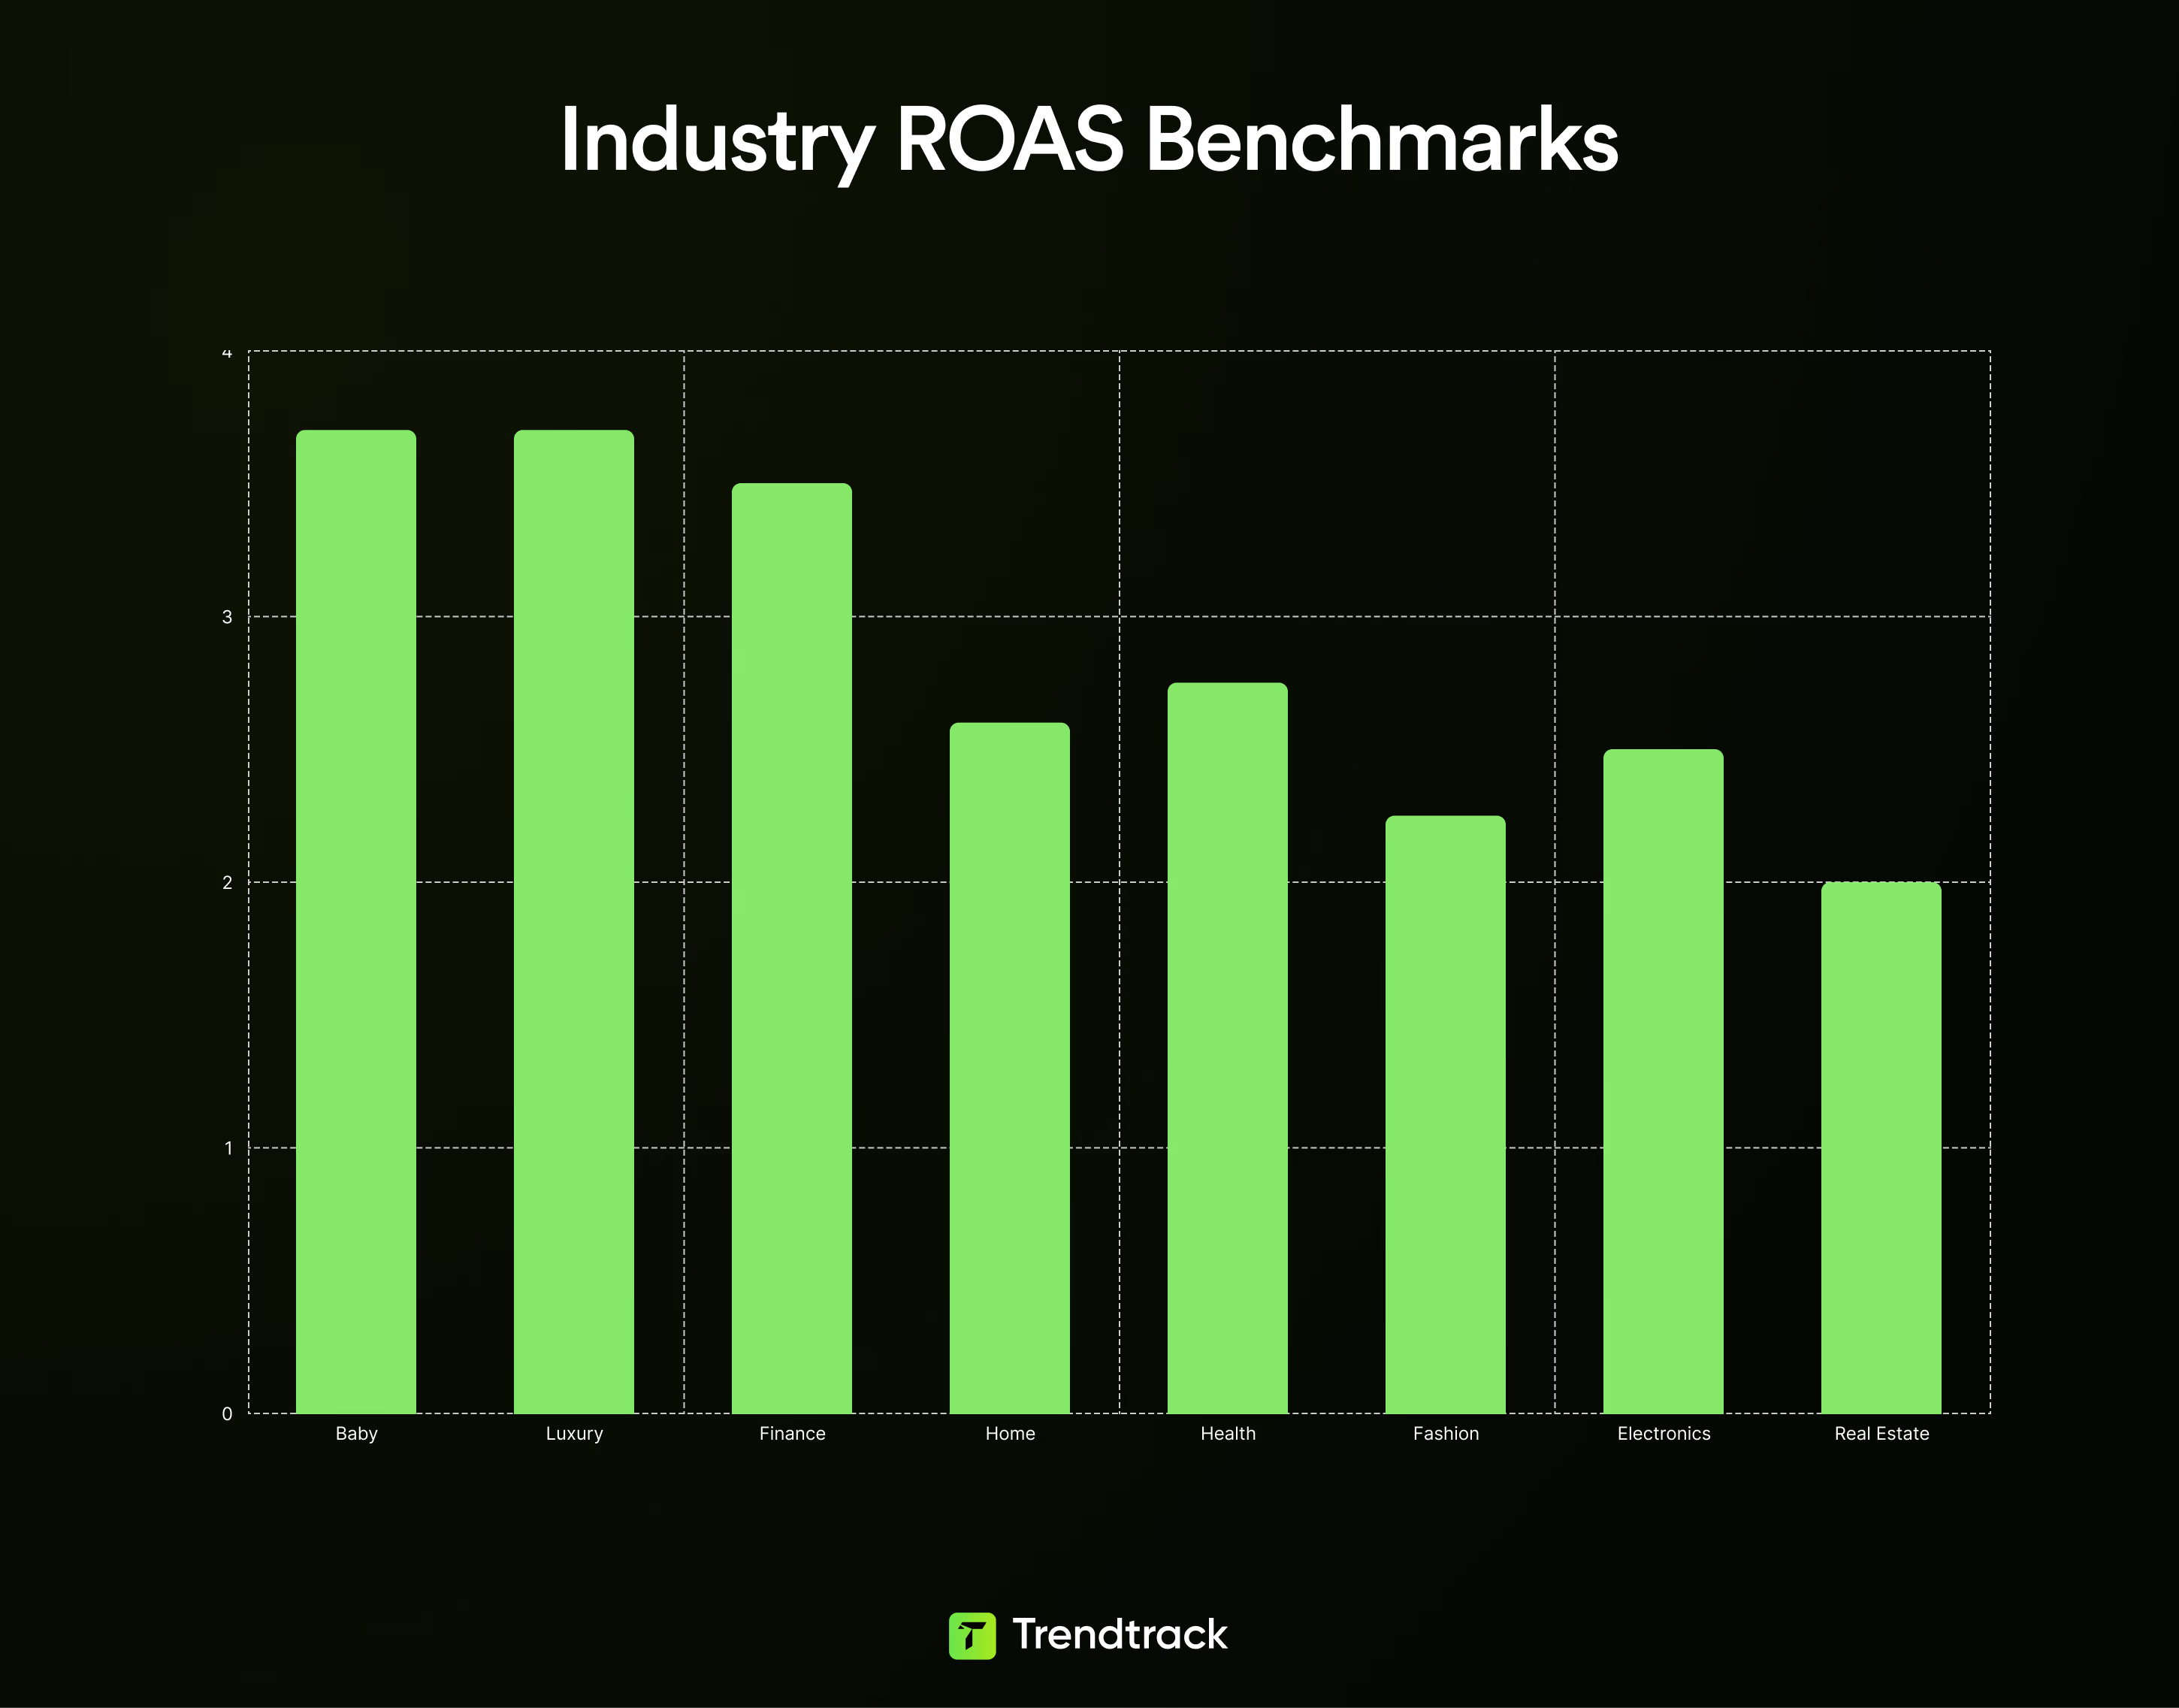
Convert spend estimates into meaningful metrics for decision-making. In case you do not know, you can learn what is a good ROAS from here. Let's turn spend into performance metrics using our $179K example:
- If their AOV is $85 and category ROAS is 3.5:1
- Estimated revenue = $179K × 3.5 = $626,500
- Estimated orders = $626,500 ÷ $85 = ~7,370 monthly orders
- Estimated CPA = $179K ÷ 7,370 = $24
Key insight: At $24 CPA and $85 AOV, they need ~28% contribution margin to break even on first purchase. If their margin is lower, they're betting on LTV."
Trendtrack provides a break-even calculator tool to test various scenarios.
Create your Google Sheets template and schedule monthly updates
Build a simple spreadsheet with these columns. Channel, Impressions, CPC/CPM, Estimated Spend, Estimated Conversions, CPA, Estimated Revenue, and ROAS.
Use color-coding to highlight priorities and automate data imports when possible (CSV, Zapier). Set aside one hour monthly to update inputs and reassess ranges.
Example rows using your benchmarks could look like:
- Google Search: 35,000 clicks, $3.20 CPC, $112,000 spend, 1,500 conversions, $74 CPA, $180,000 revenue, ROAS 1.60.
- Facebook/Instagram: 12,000,000 impressions, $8 CPM, $96,000 spend, 3,000 conversions, $32 CPA, $270,000 revenue, ROAS 2.81.
Avoid prolonged scrolling. Capture and act on these signals promptly.
You don’t need perfect numbers. Triangulate impressions, CPC/CPMs, and traffic shifts, then map these to ROAS and CPA to decide where to compete. Use visible budget signals to build a practical media plan and launch campaigns with real data.
From Competitor Ad Spend to Your Media Plan and ROI
Get ahead of your competitors by turning their spending into actionable insights. Once you identify where rivals allocate budgets, those numbers become tactical inputs instead of sources of intimidation.
Here’s how to convert competitive spend signals into a focused, measurable media plan. Validate ideas with real data instead of guessing.
Translate rival budgets into your channel mix, bids, and daily caps
Raw spend data signals opportunities, not exact plans. Avoid copying splits blindly. Instead, infer what drives revenue.

Analyze competitor spend by channel and compare it with actual revenue movement. Use Trendtrack’s Traffic and Ad analyzes to see which channels genuinely scale versus those that simply burn cash.
Focus on channels that show consistent growth and higher ROAS in your niche. For example, search often returns 10x ROAS, while social might hover lower.
Allocate budget shares based on observed revenue impact, not just ad spend. Convert ad duration and platform mix into daily caps and bid floors:
- Long-running ads suggest steady spend.
- Many short tests indicate a heavy testing budget.
Use this rule. If a platform serves as a top-of-funnel channel for competitors, treat it as awareness spend. Allocate less to direct-response bids.
Launch campaigns confidently using real data.
Use CLV and payback period to set acceptable CAC and ROAS targets
Your acceptable CAC depends on margins and lifetime value. Competitor ROAS benchmarks only tell part of the story.
To calculate breakeven ROAS, divide 1 by your profit margin. For instance, if your margin is 25%, breakeven ROAS equals 4:1.
Factor in customer lifetime value (CLV). Businesses with subscriptions or repeat purchases can accept lower front-end ROAS because payback arrives over time.
Set minimum ROAS and CAC targets based on channel roles. Acquisition channels require different thresholds than retention-focused ones.
Stress-test these targets. If a competitor looks profitable at a low ROAS, check whether they rely on lifetime valu. Through long-running ads or steady traffic growth?
Plan your cash flow around payback periods to scale without unexpected strain.
Detect seasonality windows and campaign rhythms from historical surges
Competitor timing offers a roadmap for your campaigns. Use it to schedule strategically, not just imitate.
Track historical spikes in ad counts using Brandtracker to identify launch windows like Black Friday. Align your calendar with these high-opportunity periods to maximize returns and protect margins during slow times.
Reuse effective ad formats. For example, if a UGC bundle ad performs well every Q4, treat it as a reliable conversion driver, not a one-off event.
Timing your campaigns beats spending randomly.
Spot creative fatigue and testing velocity to out-iterate competitors
You can outperform larger budgets by iterating faster and smarter.
Watch for fatigue signals. Creatives that lose efficiency rapidly or get replaced every 7 to 14 days show intense testing activity.
Check velocity signals: competitors launching many new concepts weekly focus on discovery. Match their pace or concentrate on high-quality winners.
Maintain a steady creative pipeline by launching, measuring, and retiring assets faster than competitors cycle theirs.
Build a testing tempo that outpaces even the biggest direct-to-consumer brands.
Competitive ad spend analysis fuels a disciplined media plan. Use these spend signals to establish channel mix, CAC targets, seasonality timing, and creative cadence. Stop guessing. Validate your ideas and develop a custom media plan with Trendtrack that scales your business effectively.
How to Track Competitors with Trendtrack
Trendtrack converts ad spend signals into actionable intelligence. While the platform doesn't show exact spend figures for most regions, it provides the strongest proxies available.
Ad count over time, duplication levels, days running, and actual spend filters. Here's how to use these specifically for budget estimation
Set smart filters in Trending Shops
Start in Trending Shops and adjust filters to uncover serious competitors, not hobbyists.

Use filters like:
- Traffic, with a minimum (e.g., 10k visits/month) and maximum to exclude enterprise noise.
- Growth, focusing on recent jumps, such as 50% or more in 30 days, to spot momentum players.
- Ad count, targeting 20 to 50 active ads, which usually indicates structured testing and real spending. Use daily averages over a week or month to catch high-velocity testers.
- Additional layers like category, product price, country, and Shopify apps or themes to find direct competitors.
Focus on patterns, not popularity, to steal secrets from major DTC brands.
Use Trending Ads filters (format, duplicates, days running)

The Trending Ads gallery shows where money and attention flow. Dive deep by slicing data with these filters:
- Format, to compare video, image, carousel, and DCO and see where budgets focus.
- Duplicates, as an ad duplicated 10 or more times across campaigns signals a high-budget test.
- Days running, since campaigns running 30 or more days are likely profitable, not random experiments.
- Category filters to borrow creative tactics from adjacent verticals—like using a luggage retargeting hook in apparel.
This method turns creative browsing into actionable spend signals.
Activate Brandtracker
Brandtracker serves as your competitor command center. Add stores to watch:
- Active ad counts and weekly cadence, distinguishing between bursts and sustained flights.
- Creative libraries, headlines, and landing pages for direct comparison.
- Visual seasonality charts that highlight rises around events like Black Friday and Mother’s Day.
For example, a jump from 15 to 45 active ads in a week signals a launch. Track cadence to decide whether to match, preempt, or counterattack with confidence and real data.
Turn Trendtrack's data into spend estimates using this formula:
Estimated Weekly Spend = (Active ads × Average longevity) × (CPM benchmark ÷ 1000) × Estimated impressions
Example: A competitor runs 50 ads for 3+ weeks with a 40% traffic spike:
- 50 ads × 21 days = sustained campaign
- 40% traffic increase suggests ~2M additional weekly impressions
- $7 CPM × 2,000 = $14,000 estimated weekly social spend
Cross-reference with known benchmarks:
- Ads running 30+ days typically indicate profitability, not just testing
- 10+ duplicates suggest high-budget scaling
- Sudden traffic spikes aligned with ad volume increases confirm media pushes
Turn insights into action
Data without execution wastes time. Turn insights into clear moves by:
- Validating ideas without guessing by replicating top-performing hooks in controlled tests.
- Timing campaigns to match or avoid seasonality windows based on competitor cadence.
- Saving the longest-running winners, dissecting headlines and CTAs, and iterating faster.
- Matching bid rhythms—if rivals dominate weekends, secure early-week advantages.
- Building a Trendtrack swipe file and making sprint reviews routine to avoid endless scrolling.
Following these steps helps you test and outmaneuver competitors with less waste. Validate ideas confidently using real data. Study how the fastest growing DTC brands time their ad spend and creative refreshes to stay ahead.
{{cta-2}}
Turn Competitor Spend Signals Into Your Competitive Edge
You now have the framework to track competitor ad spend without enterprise budgets or guesswork. Start with the 10-minute checklist. Pick one rival, scan their ad libraries, count active campaigns, and triangulate spend using impressions and CPM benchmarks.
Use Trendtrack to automate monitoring and catch seasonality spikes before they peak. Build your simple Google Sheets estimator to map spend to ROAS, CPA, and payback targets.
The brands that scale fastest don't outspend competitors blindly. They decode budget signals, match testing velocity, and time campaigns around proven seasonal windows.
Your next move: choose one competitor, implement the checklist today, and schedule your first monthly review. Competitive intelligence becomes your advantage when you act on it consistently.


.avif)
Ready to build a millions dollars brand ?
.avif)
