Calculate your break-even ROAS: a step-by-step guide


It is a fact that, most of the ecommerce brands flush money down the digital drain. Because they can't distinguish between profitable ad spend and costly vanity metrics.
Marketers obsess over impressive-looking ROAS figures. However, the cold truth is that a dazzling 5x return might still be bleeding your business dry. The secret weapon? Break-even ROAS (BEROAS) – the mathematical tipping point that separates financial sustainability from slow bankruptcy.
Calculating this critical threshold isn't just another marketing exercise. It's the difference between scaling profitably at 127% year-over-year growth. Or joining the 40% of DTC brands that collapse within their first year. In this guide, we will explain you properly how to calculate ROAS.
Understanding the Core Metrics for Profitable Advertising
The numbers behind digital advertising do more than measure campaign success. They act like the dials on a cockpit. Change one, and your entire strategy shifts. Two key dials demand your attention: Return on Ad Spend (ROAS) and its more precise counterpart, Break-even ROAS (BEROAS).
What Is Return on Ad Spend (ROAS) Versus Break-Even ROAS (BEROAS)?
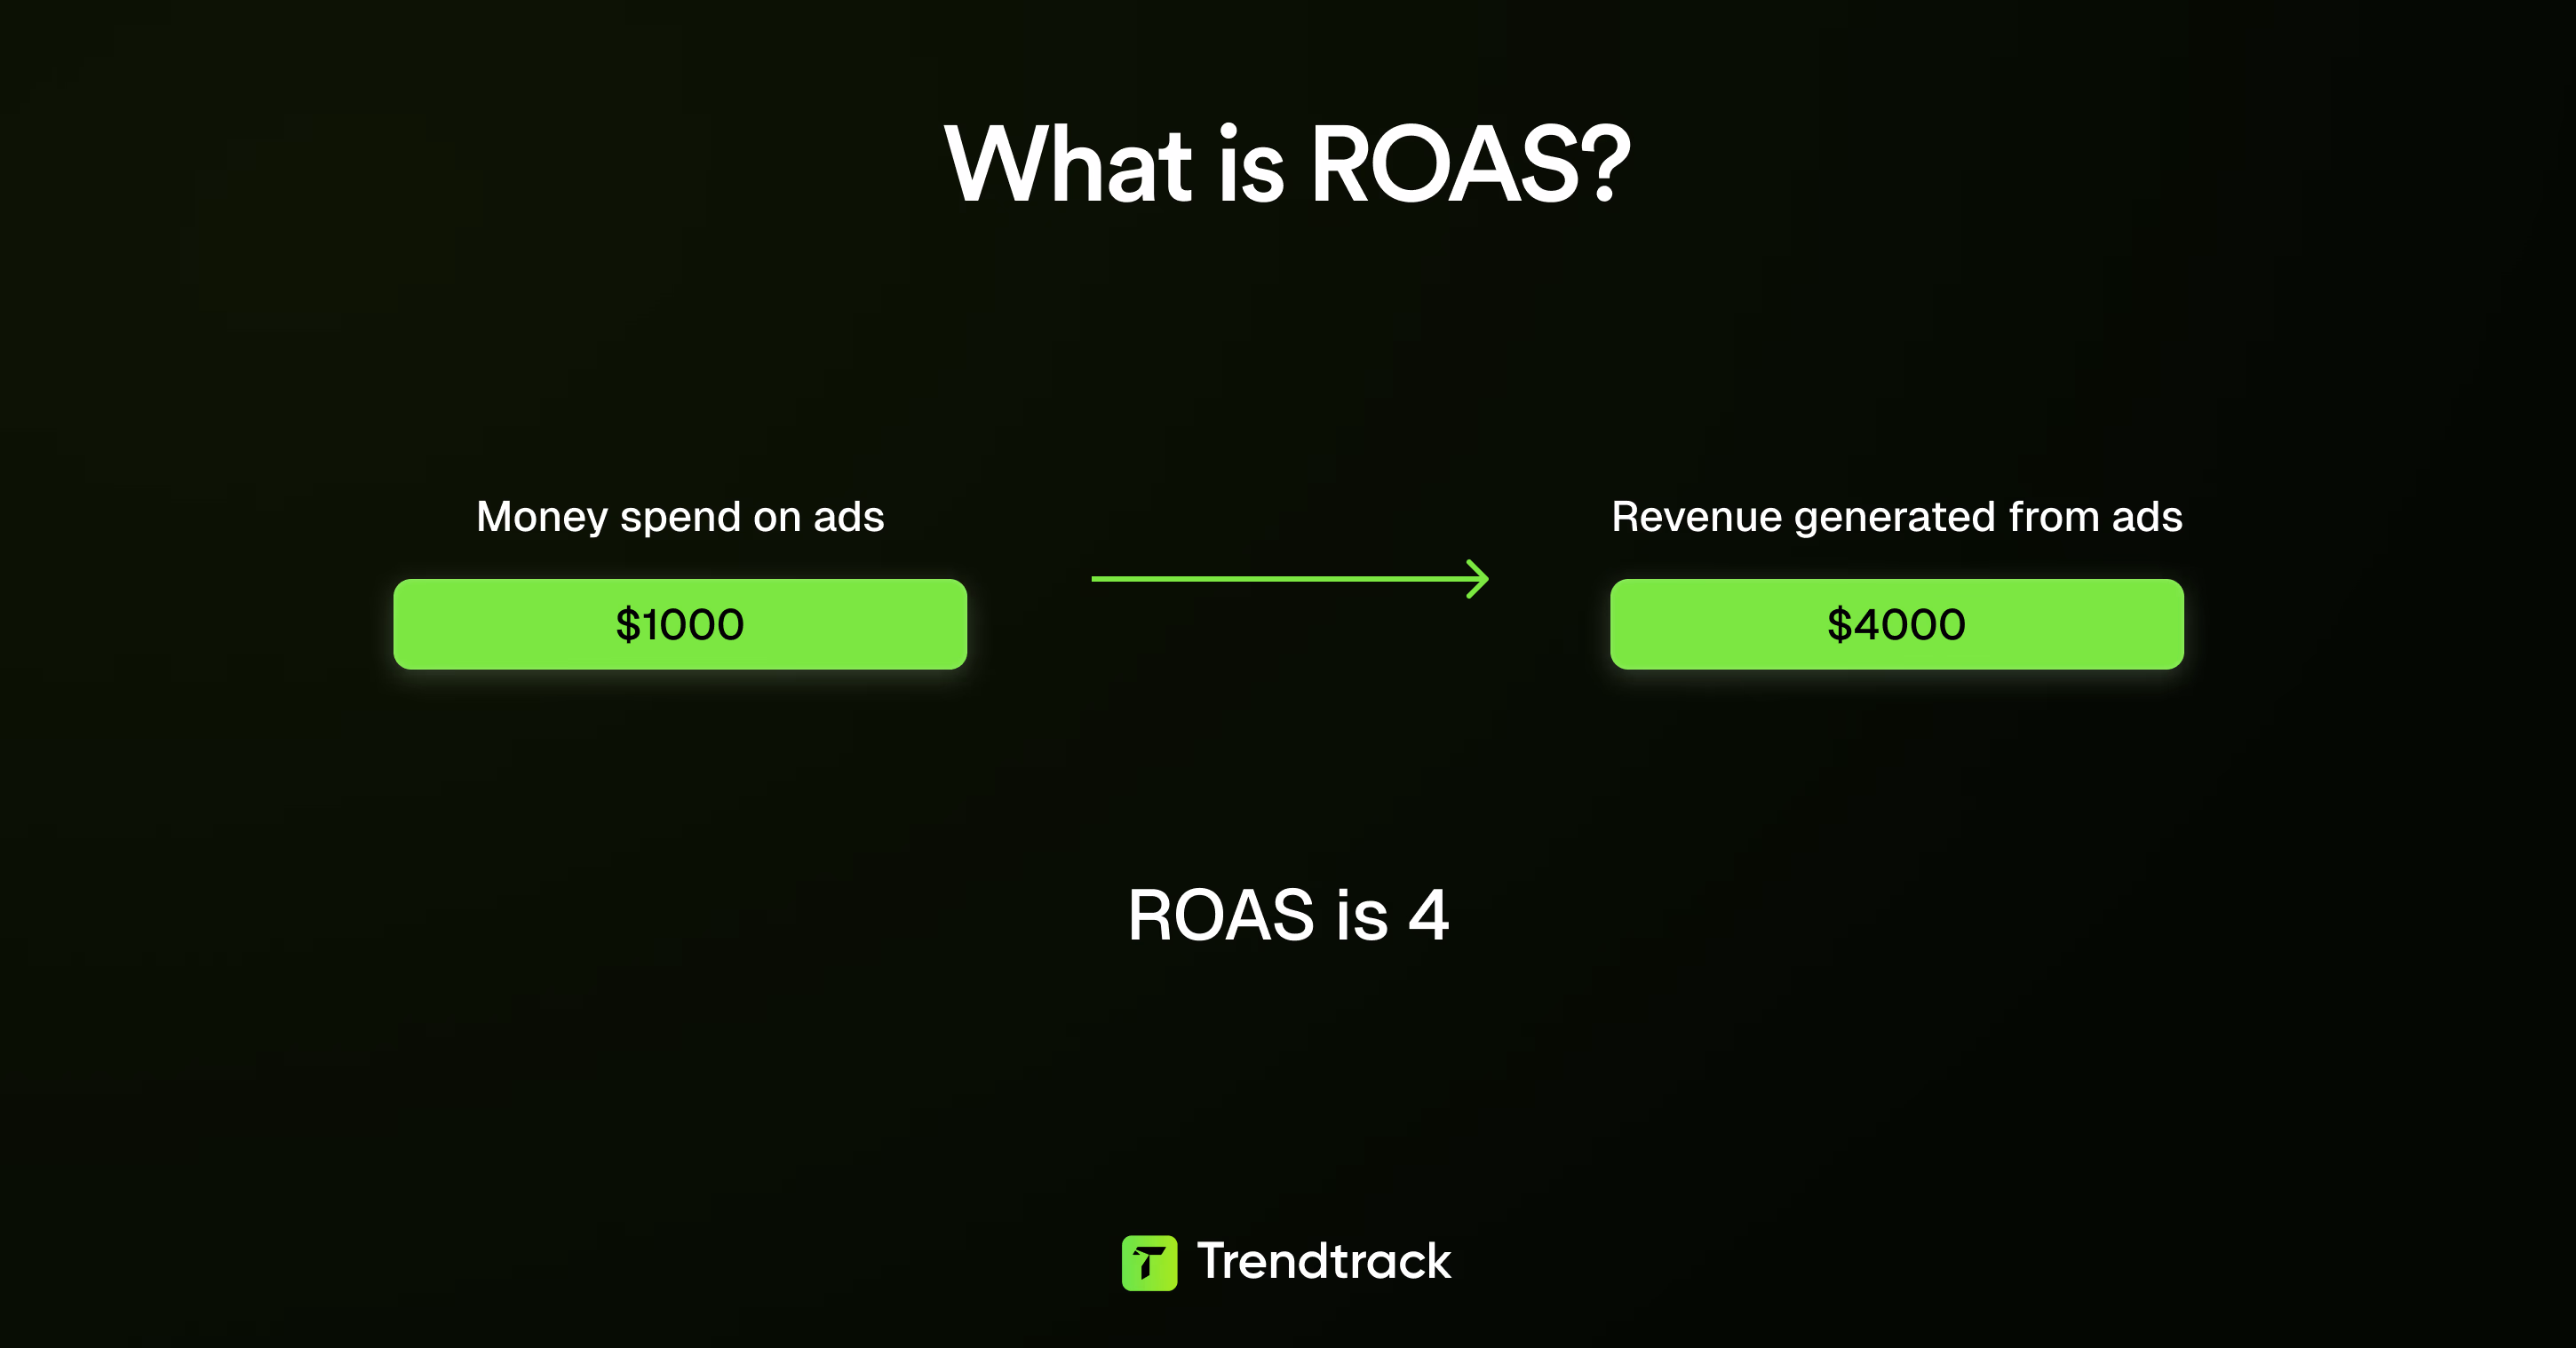
ROAS measures revenue generated from ads divided by the cost of those ads. For example, a ROAS of 4 means every $1 spent brings in $4 of revenue. It sounds great, but ROAS doesn’t show what remains after production, shipping, payment processing, and other hidden fees.
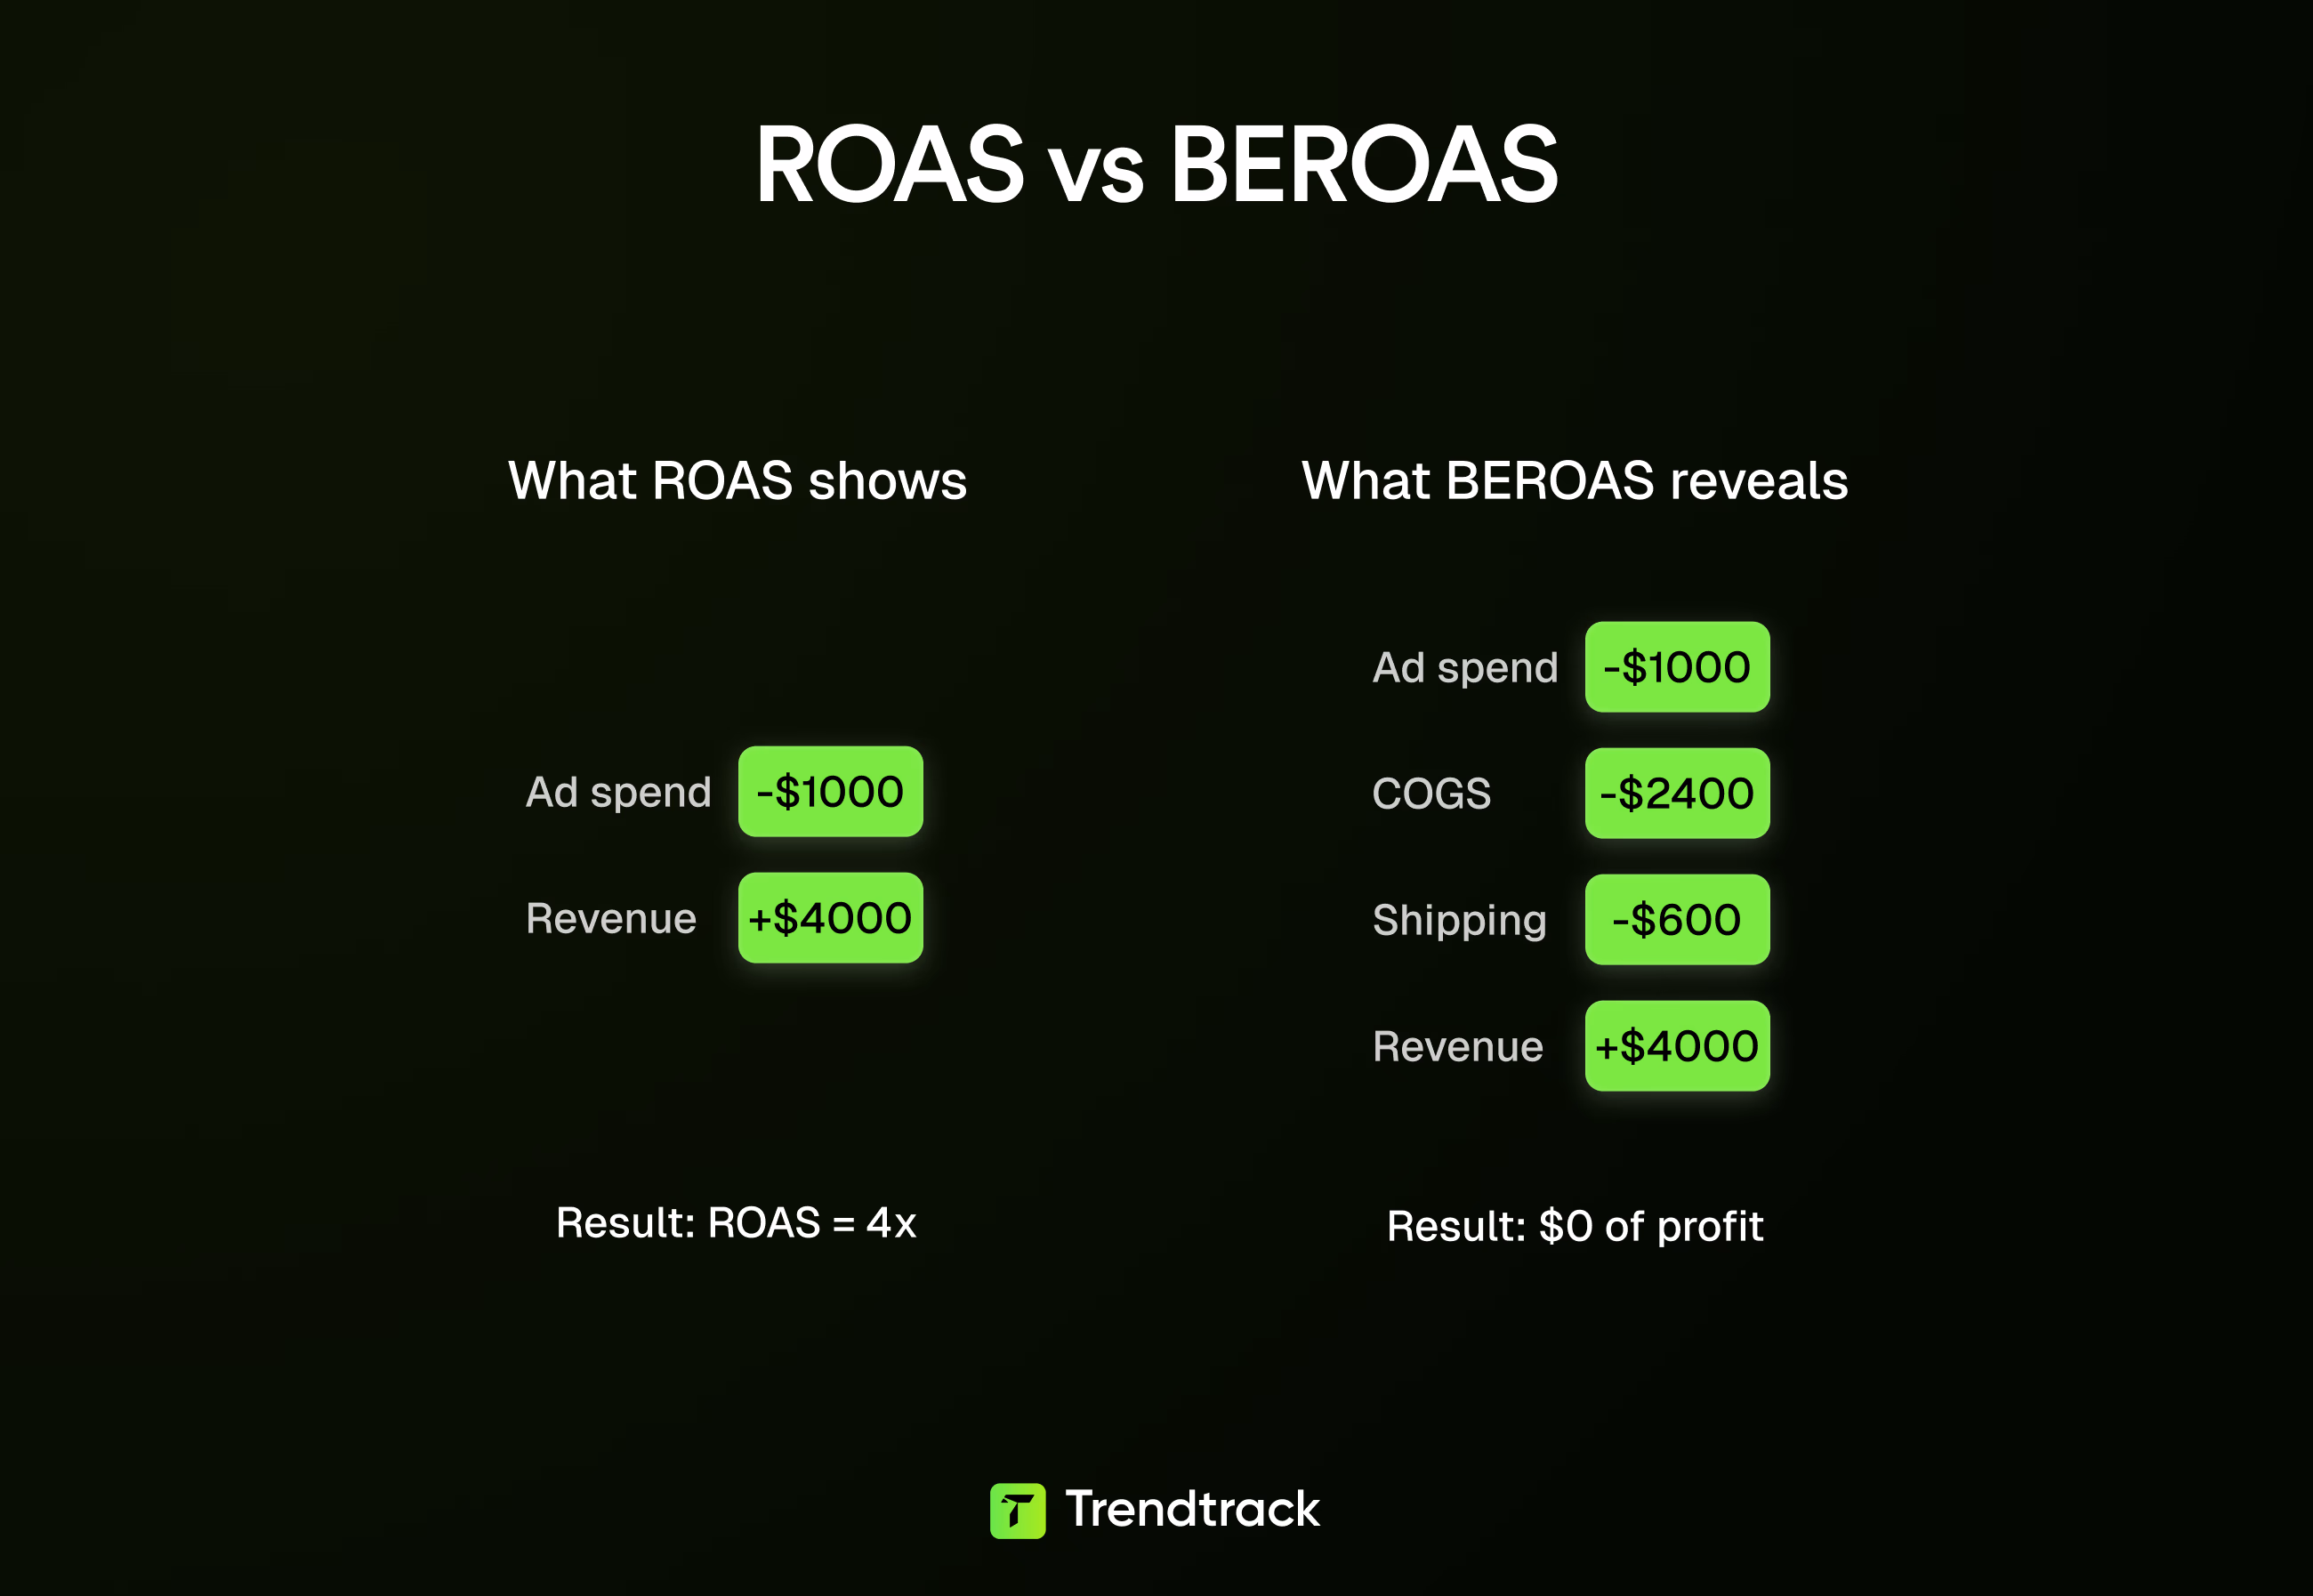
BEROAS fills that gap. Think of BEROAS as your oxygen tank. If your ROAS drops below this number, you’re burning cash. Hitting BEROAS means breaking even, and surpassing it means making real profit. Falling short means you lose money without realizing it.
Why Calculating Your BEROAS Is Crucial for Ecommerce Profitability
Ecommerce margins are razor-thin. For example:
- A clothing business with a 20% margin needs a BEROAS of 5—$5 revenue for every $1 spent—to break even.
- A supplement brand with a 60% margin only needs a BEROAS of 1.67.
This sharp difference shows why skipping BEROAS calculations is risky.
Without knowing your BEROAS, “successful” campaigns can quietly drain your profits. Many brands chase campaigns that look winning but fail because repeat customers don’t return.
Knowing your BEROAS upfront turns ad spend from a gamble into confident, strategic growth. It acts as a guardrail that protects your cash and signals when it’s time to increase spending.
The Difference Between BEROAS and Return on Investment (ROI)
ROI looks at the bigger picture, covering all expenses from payroll to software.
- ROAS and BEROAS track your ads’ real-time performance.
- ROI shows if the entire business is profitable.
You might have a high ROAS but low ROI if other expenses eat up profits. Or a modest ROAS paired with a strong ROI if you manage costs tightly.
Smart operators watch all three metrics closely. BEROAS provides an instant signal of when growth is solid versus risky.
The Simple Formula to Calculate Break-Even ROAS
Break-even ROAS is a ratio that shows how much profit remains after fulfillment. And also, how much you can spend to acquire new customers. Without losing money.
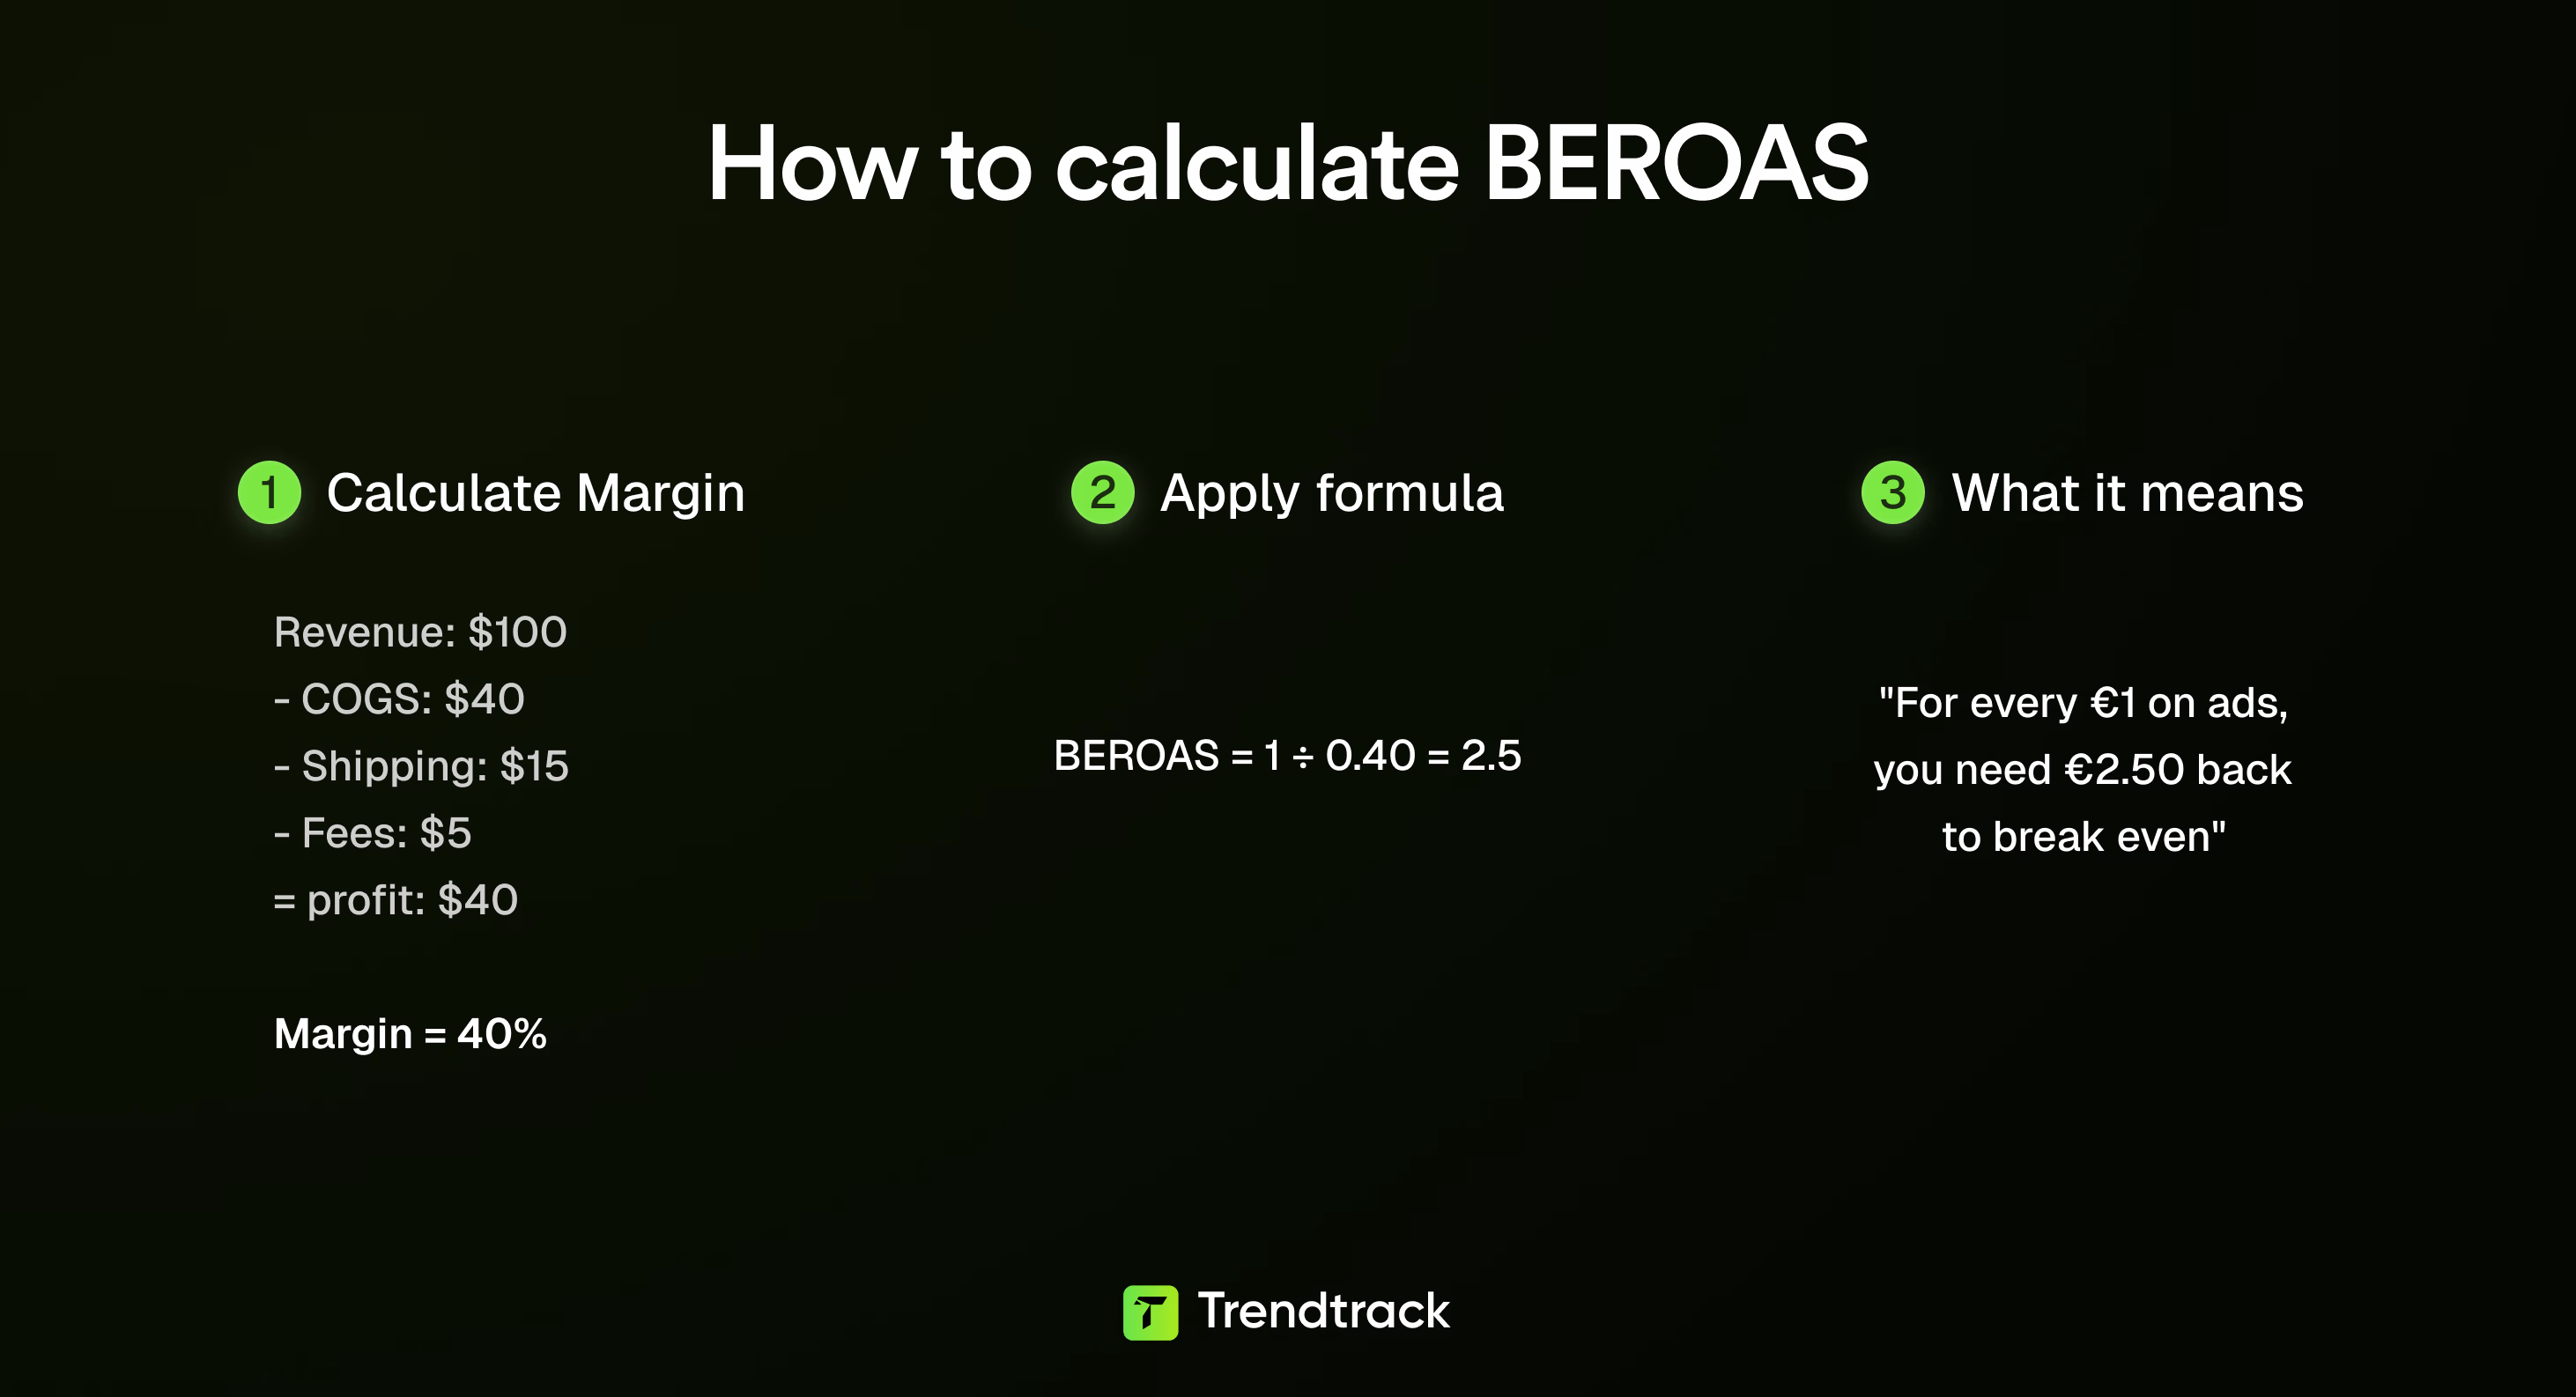
To find it easily, invert your profit margin:
Break-even ROAS = 1 ÷ profit margin
For example, if your profit margin is 25%, divide 1 by 0.25 to get a break-even ROAS of 4. This means you need $4 in ad-driven revenue for every $1 spent to break even.
This number looks simple, but it depends on many assumptions. Missing any could lead you to chase a figure that doesn't protect your profits.
The Primary Formula: 1 ÷ Profit Margin
Your profit margin measures how efficiently you turn revenue into real profit. Dividing 1 by your profit margin reveals exactly how many sales dollars are needed for every ad dollar to cover costs.
For instance, a break-even ROAS of 2 seems manageable. But if your margin is 50%, you only keep $0.50 from each dollar of revenue after costs. A 2:1 ratio means you’re just trading dollars without making profit.
A Detailed Breakdown of the Components: Revenue and Costs
Here’s what makes up your profit margin:
- Revenue per order: Use actual sales data, not guesses. A higher average order value (AOV) lowers the ROAS you need.
- Cost of Goods Sold (COGS): Includes production, packaging, and per-unit fees like Shopify charges.
- Variable fulfillment costs: Shipping, processing, and pick-and-pack fees, which add up per order.
- Marketing costs excluded: Include only product delivery costs here. Your ad spend is what this formula aims to cover.
Exclude fixed overheads like salaries and rent unless you want the total break-even point. Including these pushes your ROAS target too high, potentially limiting growth.
How to Accurately Calculate Your Profit Margin
Profit margin is more than revenue minus COGS. Variable costs can appear in many places, so track all that change with each sale:
- Use a representative sample, such as 100 orders, to avoid distortion from one-off expenses like expensive rural shipping.
- Align all costs with the same timeframe and currency as your AOV.
- Include only variable costs that increase with each sale.
Accurately calculating this margin gives you a solid base for ROAS decisions. Missing details can hide losses in supposedly profitable campaigns.
Defining Cost of Goods Sold (COGS) and Other Variable Costs
Many businesses underestimate COGS by stopping at supplier invoices. But break-even ROAS requires factoring in more:
- Product acquisition cost: What you pay to buy the product.
- Packaging: Branded boxes, inserts, bubble wrap, and other materials.
- Duties and import fees: Costs for international shipping added per unit.
- Platform fees tied to sales: Fees like Shopify’s 2.5% payment charge that grow with sales.
- Fulfillment partner fees: Costs for picking, packing, labeling, and handing off units to carriers.
This matters because adding these costs can significantly reduce margins. For example, if shipping costs $4 on a $20 product, you lose 20% before marketing. Your break-even ROAS then jumps from 2.5 to about 4.1.
Do you want to explore more on how leading dropshippers stay profitable? Dive into strategies for sourcing winning products with this guide on the best product research tool for dropshipping.
A Step-by-Step Guide to Calculating Your BEROAS Manually
Calculating break-even ROAS involves analyzing your order economics to find the point where your revenue turns into real profit. It requires breaking down costs and understanding your profit margin clearly.
Step 1: Determine Your Average Order Value (AOV)
Start by calculating your AOV, which is the average amount a customer spends per order. Clean your data first by removing returns, refunds, and fraudulent orders. For example, if 1,200 orders generate $48,000 in revenue, your AOV is $40 ($48,000 divided by 1,200).

Your AOV is important because it defines how much you can spend on advertising without hurting your margins. A higher AOV means you can afford higher ad costs while maintaining profitability.
Step 2: Calculate All Costs per Order to Find Your True Profit Margin
Identify every cost involved in fulfilling an order. These include:
- Cost of goods sold (COGS): The cost to produce or purchase the product.
- Fulfillment costs: Packaging, labor, and shipping fees.
- Transaction fees: Charges from payment processors or platforms like Shopify.
- Variable overhead: Extra costs like storage or special handling per order.
For example, if a $40 order costs $16 to produce, $4 to ship, and $0.80 in payment fees, your gross profit is $19.20. Even small costs like a $0.25 packing insert add up when you scale. Missing these details can quietly reduce your margins and affect your break-even calculations.
Step 3: Apply the Break-Even ROAS Formula with a Worked Example
Use the formula to calculate your break-even ROAS.
Using the example values, a $19.20 profit on a $40 order gives a 48% margin ($19.20 divided by $40). Plugging this in: 1 ÷ 0.48 = 2.08
This means every dollar spent on ads must bring in $2.08 in revenue to break even. Spending below this threshold means your ads lose money, even if your creatives look effective.
Step 4: Adjust Your Calculation for Different Business Models like Dropshipping
Business models affect costs and margins, so your break-even ROAS changes accordingly.
- Dropshipping: Usually involves lower upfront costs but higher per-unit prices and added customer service expenses. For example, a 25% margin in dropshipping requires a BEROAS of 4.0, while a 50% margin business requires only 2.0.
- Subscription businesses: These may accept a BEROAS as low as 1.0 in the first month because recurring revenue and low churn improve long-term value. In such cases, lifetime value matters more than strict break-even formulas.
Understanding your specific business model helps you set realistic BEROAS targets and maintain profitability.
Once you calculate your BEROAS, it becomes a clear benchmark. Frequent ad spending below this number will lead to losses.
Want to verify your calculations quickly? You can use Trendtrack’s ROAS Break-Even Calculator to validate your numbers and confidently plan your next campaign. Just let me know!
{{cta-2}}
Using a Break-Even ROAS Calculator for Quick Insights
Numbers reveal the truth faster than gut instinct—if you use the right tool. Our break-even ROAS calculator cuts through marketing noise and shows the baseline your ads must reach before you make a profit.
The Trendtrack BEROAS calculator eliminates spreadsheet hassles and tab switching. It offers everything in one simple interface. Enter your product price, cost of goods, shipping, and transaction fees. Instantly, you get the exact ROAS that separates profitable campaigns from money-losing ones.

For example, imagine comparing two campaigns for the same product. One has a ROAS of 2.4, the other 2.1. Pretty close, right? But the calculator shows your break-even is 2.35.
Now it’s clear one campaign turns a profit while the other drains your budget. Raw spreadsheets can't provide this clarity without hours of formula work.
Key Inputs Required for Precision
Getting an accurate result requires precise numbers. Avoid guessing—use confirmed data:
- Selling price per unit — focus on the exact SKU, not your shop’s average order.
- Cost of goods sold (COGS) — include every cost: manufacturing, wholesale, and more.
- Shipping and handling costs — consider whether you absorb or pass them to customers.
- Platform fees — include payment processors or Shopify fees.
- Taxes and VAT — leaving these out creates a false break-even point and risks wrong decisions.
Providing these details ensures the calculator reflects your actual business, not a rough estimate.
Curious about what counts as a strong return? Explore the key factors behind what is a good ROAS for Ecommerce and set smarter targets for your next campaign: What is a good ROAS for ecommerce.
How to Use Your Break-Even ROAS to Optimize Ad Spend
Treat break-even ROAS (BEROAS) not as a fixed number but as your navigation tool. It helps you decide when to increase ad spend, pause campaigns, or change direction.
Setting Realistic Target ROAS on Advertising Platforms
BEROAS provides your safety net, while target ROAS (TROAS) reflects your profit goals. Setting TROAS exactly at BEROAS leaves no profit margin. On the other hand, setting it too high starves algorithms of data and harms performance.
Consider TROAS as a range. For example, if your BEROAS is 2.0, aiming for:
- 2.2 to 2.5 TROAS during high-volume testing, allowing flexibility while staying agile
- 3.0 or higher TROAS for top-performing campaigns focused on profit
Use bid strategy reports to check if your targets align with real data. This approach helps you avoid wasted spend and ensures your goals support confident campaign launches.
Making Data-Driven Decisions on Google Ads and Facebook Ads
Google and Meta attribution can be misleading initially. Results may appear weak within the first 24 hours but improve over the conversion window.
Align your review schedule with your customer buying cycle. For example, if it usually takes five days for shoppers to decide, don’t judge performance after just two days. Use your BEROAS as a checkpoint to avoid premature campaign shutdowns and endless dashboard monitoring.
Struggling to understand why competitors seem to have better ROAS? Track competitor Facebook ads to uncover their strategies and improve your own campaign performance.
Knowing When to Scale Winning Campaigns and When to Cut Losses
Only scale campaigns that perform consistently well above your BEROAS. A single day of good ROAS is not enough proof.
Increase your budget gradually, such as by 20 to 30 percent at a time. This approach catches drops early and avoids sudden losses.
If a campaign runs below BEROAS for three consecutive review periods, it’s time to reduce spend or rethink the strategy.
Want to streamline campaign analysis even further? Learn how using a Shopify product exporter can help you quickly pull the data you need for accurate BEROAS calculations.
Using BEROAS to Inform Your Bidding Strategy and Budget Allocation
Divide your campaigns into three groups for effective budget allocation:
- Below BEROAS: Keep these only if they serve broader goals like brand awareness or market entry
- At BEROAS: Monitor closely. Small improvements could make them profitable
- Above BEROAS: These campaigns drive growth. Invest heavily here to maximize returns
Avoid funding underperformers out of hope. Use your BEROAS as a clear boundary: invest in growing campaigns and cut those dragging your performance. This strategy keeps you competitive and efficient.
Master Your Advertising Profitability
Calculating break-even ROAS isn't just a mathematical exercise. It's the foundation for transforming your advertising from a cost center into a profit generator.
Armed with your BEROAS number and Trendtrack's powerful calculator, you can now confidently set campaign targets that ensure profitability, make data-driven budget allocation decisions, and systematically scale what works while cutting what doesn't.


.avif)
Ready to build a millions dollars brand ?
.avif)
