How to Improve ROAS: 13 Tactics That Actually Work


Spend $1 on ads and get $3 in sales back. That’s a 3:1 ROAS. The math is simple, but the context changes everything. A jewelry brand with big margins can do well at 3:1. A low-margin dropshipping store can still lose money with the same ratio.
ROAS (Return on Ad Spend) measures how much revenue each advertising dollar generates.

ROAS = Revenue from ads ÷ Cost of ads
This simple formula hides complexity. A high ROAS doesn’t always mean profit, and a low ROAS isn’t always bad. Your margins, business model, and growth stage determine what a “good” ROAS looks like. Using ROAS the right way helps you stay ahead of competitors.
Understanding the ROAS formula and calculation
Revenue from ads isn't just immediate sales. It includes direct conversions from clicks, sales influenced by multiple touchpoints across channels. Plus, for subscription businesses, the full lifetime value of a customer.
That $30 first purchase might represent $180 over time, which completely changes how you evaluate performance.
True ad costs go beyond media spend. You need to account for creative production, agency fees or team salaries, and technology like analytics and attribution tools. Ignoring these costs inflates your ROAS and hides whether you're actually profitable.
Your attribution method shapes everything. Last-click attribution undervalues upper-funnel campaigns that drive awareness, while multi-touch attribution spreads credit across the entire customer journey.
Track both surface-level ROAS for quick scaling decisions and fully-loaded ROAS to see real profitability. Use A/B testing to validate what actually works instead of guessing.
Want to benchmark your performance against industry standards? Learn what constitutes a good ROAS for ecommerce so you know whether your 5:1 or 7:1 return is actually competitive in your category.
Why ROAS is critical for profitability in ecommerce
When margins are thin (10–20%), small ROAS changes can flip profits to losses. ROAS acts as an early warning system, showing whether ads fund growth or drain cash.
Example for a clothing retailer:
- $10,000 ad spend leads to $50,000 revenue at 5:1 ROAS
- 60% COGS results in $20,000 gross profit
- Shipping costs $3,000 and payment fees about $1,250, leaving $15,750
- Subtract $10,000 ad spend and net profit is $5,750
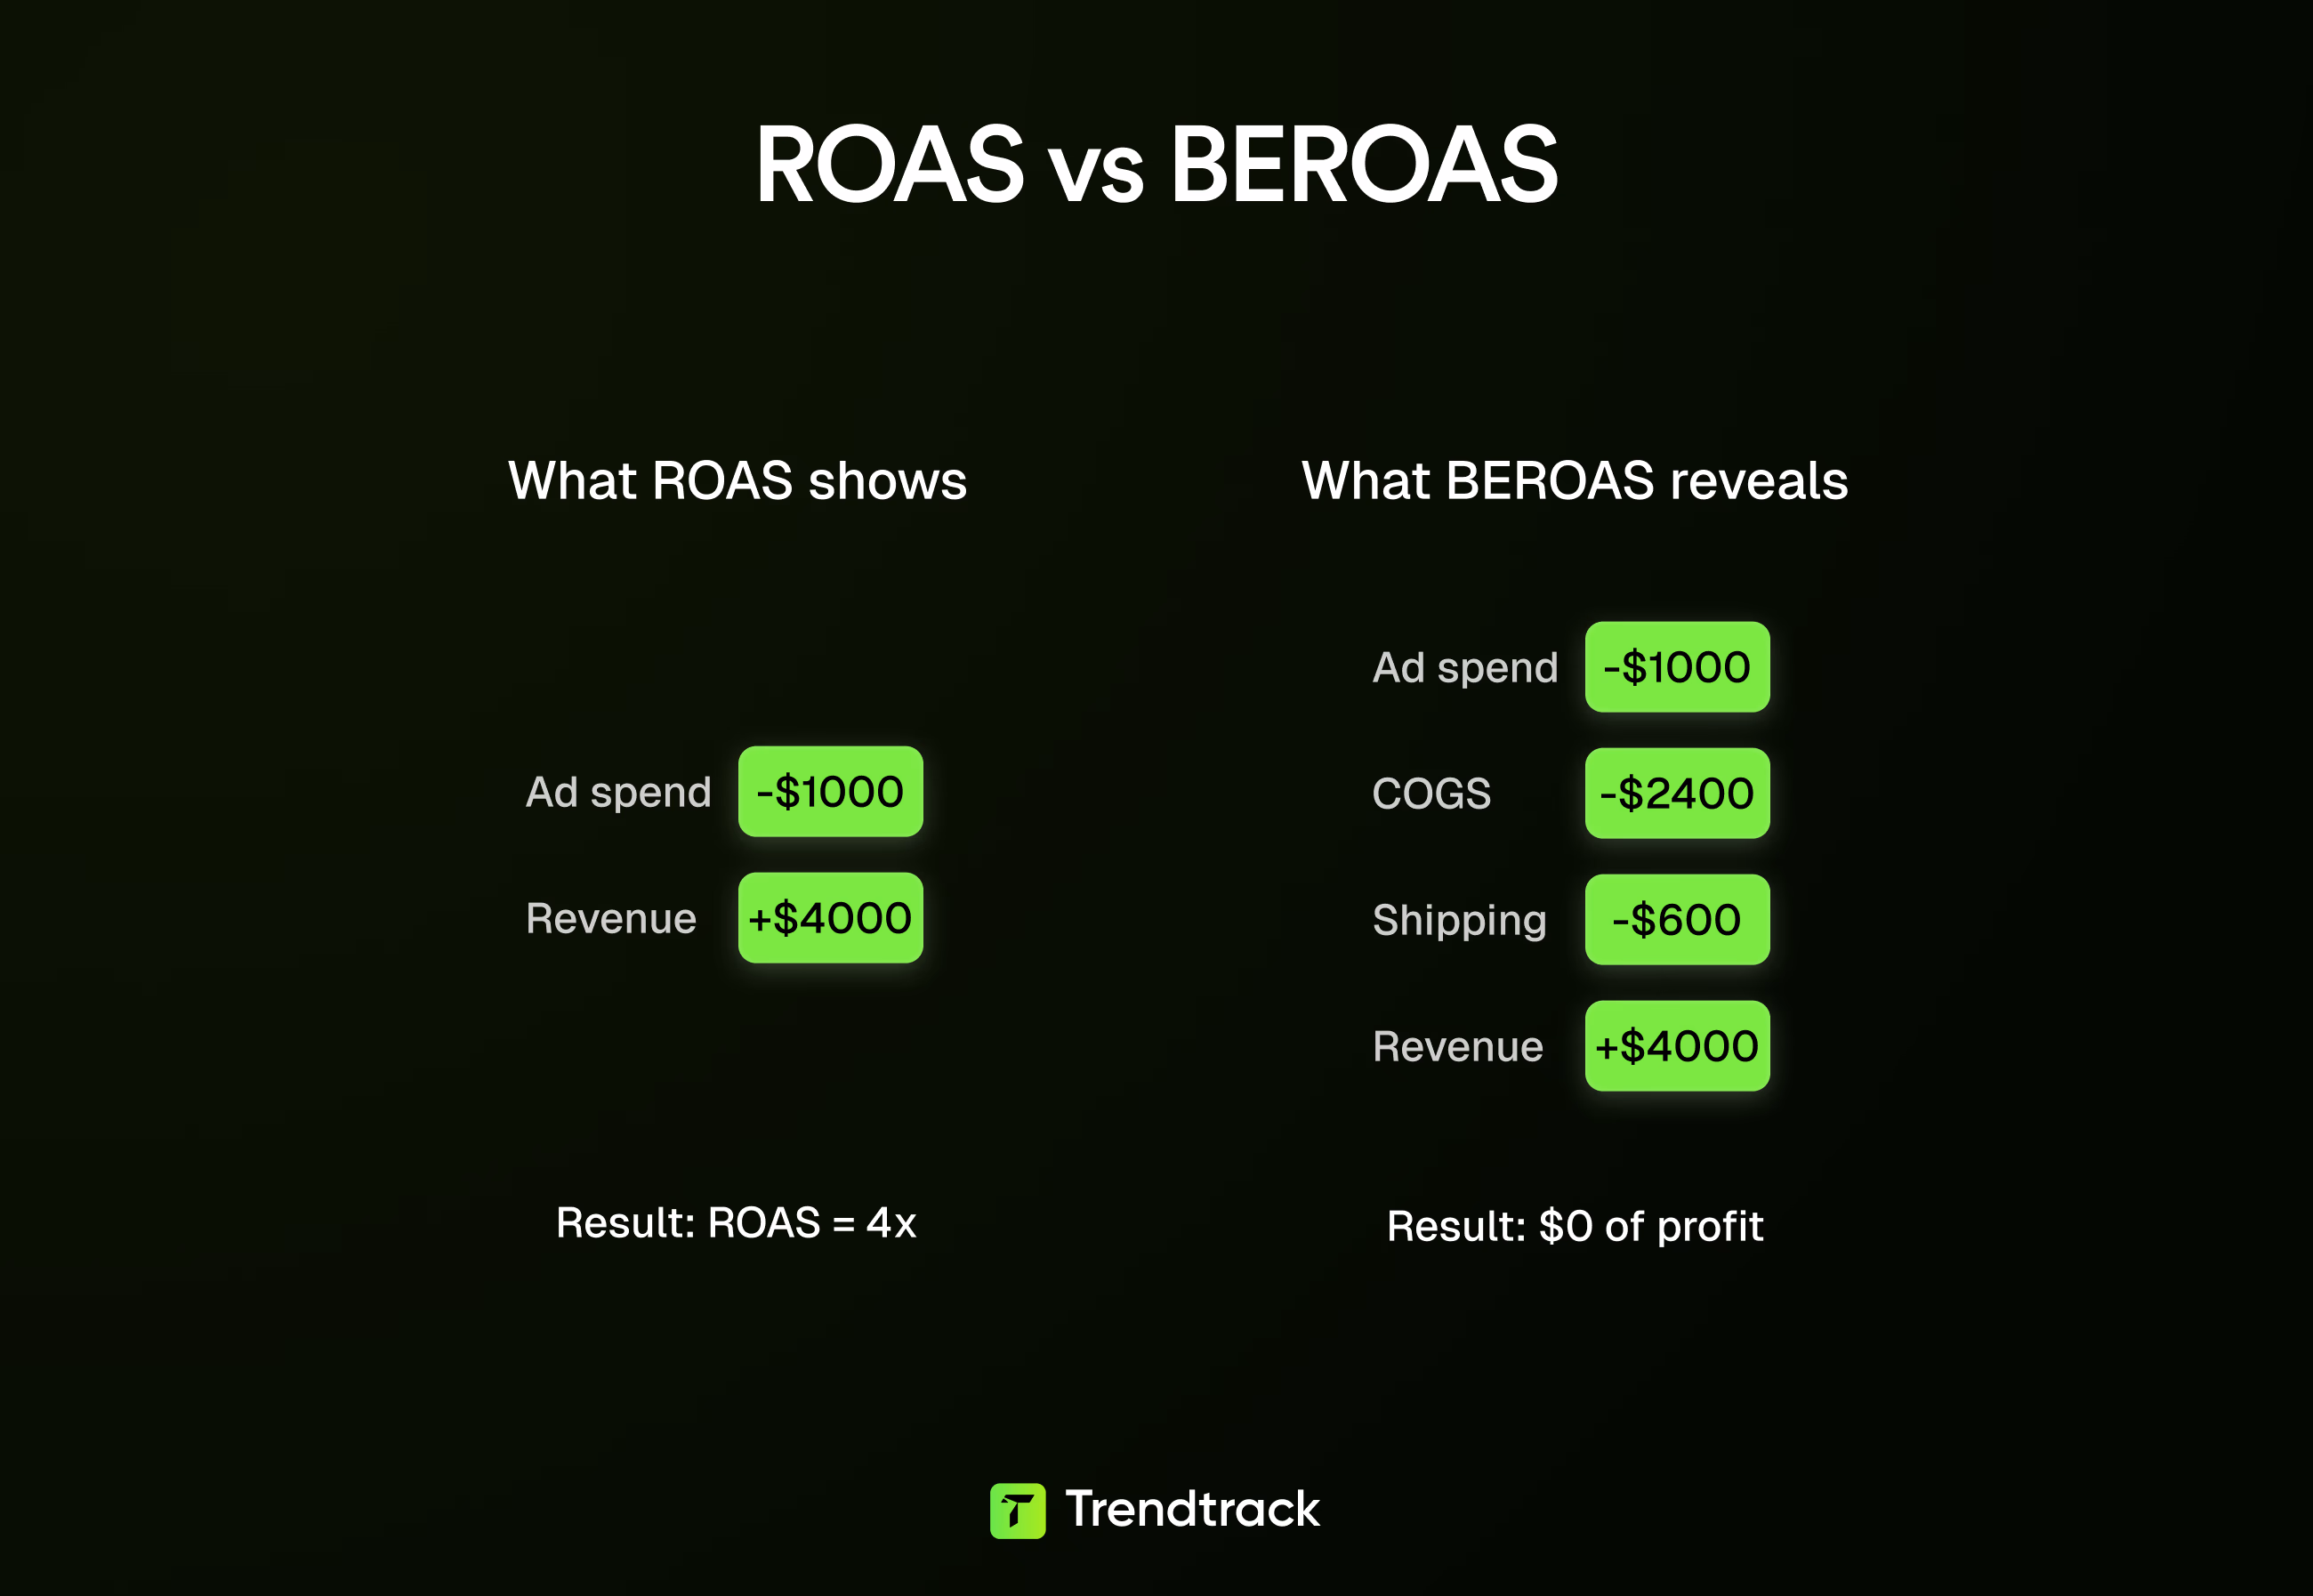
The revenue looks good but after costs, profits are small or close to break-even. ROAS prompts unit-economics conversations so you don’t scale growth that destroys margins. Measuring both headline ROAS and fully-loaded returns helps launch confidently with real data.
ROAS also guides budget allocation quickly:
- A campaign hitting 7:1 deserves more spend.
- One at 1.8:1 needs fixes or to be stopped.
Without ROAS, you spread budget evenly, while some channels create profit and others waste money. Here are some common mistakes:
Mistake: Treating ROAS as one-size-fits-all
Different campaign types serve different roles. Retargeting and cart abandonment ads should hit higher ROAS, but prospecting and awareness campaigns usually run leaner. Applying a single ROAS target across all campaigns wastes money or stifles growth.
Mistake: Ignoring profit margins when setting targets
A 3:1 ROAS works for high-margin businesses but destroys low-margin ones. Use breakeven ROAS = 1 ÷ profit margin as a minimum. Many brands set targets below breakeven and wonder why scaling loses money.
Mistake: Relying solely on last-click attribution
Stopping awareness ads due to poor ROAS cuts off the top of the funnel. Those ads often seed future conversions through other channels.
Mistake: Blindly following platform benchmarks
Benchmarks lack context. A “good” ROAS for one business can be disastrous or fine for another. Don’t waste time scrolling through benchmark posts. Instead, apply your own unit economics.
The main error is not the ROAS number but copying others without considering your margins, model, and goals. Adapt targets that make sense for your business.
Calculate your breakeven and target ROAS
Define what “success” means for your business before raising your ROAS. Set targets that match your margins and goals to stay ahead of competitors.
How to determine your breakeven ROAS based on profit margins
Your profit margin determines the minimum ROAS you need to calculate break even:
Breakeven ROAS = 1 ÷ Profit Margin
For example:
- Premium supplements priced at $100 with $40 production and shipping costs have a 60% margin. Their breakeven ROAS is 1.67:1.
- Electronics with a 20% margin have a breakeven ROAS of 5:1.
A 4:1 ROAS can be profitable or risky depending on margins. Use the breakeven formula as your minimum to avoid celebrating revenue while losing money.
Factoring in COGS, shipping, and operational costs
Include all variable costs that grow with each sale, not just COGS:
- Shipping
- Payment processing fees
- Packaging
- Customer service costs per order
For example, a $30 T-shirt with $8 production costs appears to have a 73% margin. But adding $4 shipping, $1 processing, $2 customer service, and $1.50 packaging lowers the margin to about 45%. This pushes breakeven ROAS from 1.4:1 to 2.2:1.
Also, consider your average order value (AOV). Higher AOV spreads fixed costs across more products, giving you more flexibility in ROAS targets. Calculate these true per-unit costs to evaluate ideas accurately.
Setting realistic ROAS targets for your business stage
Your business stage affects the ROAS you should aim for:
- Early-stage or venture-backed companies often accept 1.5–2.5:1 ROAS to grow market share.
- Bootstrapped or cash-limited businesses need higher ROAS, usually 4:1–5:1+, to remain solvent.
Market conditions also matter. Crowded markets often mean lower initial ROAS, while niches allow for higher returns.
Funded brands can prioritize growth at lower ROAS, while self-funded brands must focus on profitability immediately. Align ROAS targets with your runway and goals to launch confidently.
Using customer lifetime value to inform ROAS goals
Customer Lifetime Value (CLV) helps you see ROAS as a long-term measure. Brands with subscriptions or repeat customers can afford lower initial ROAS because they recover costs over time.
For example, a coffee subscription with a 2:1 ROAS on first orders makes sense. Of course, if the average customer stays for eight months at $30 per month. The lifetime revenue exceeds the initial acquisition cost.
Implications include:
- Track first-time and repeat buyers separately.
- Set lower ROAS targets for prospecting campaigns and higher ones for retention or retargeting.
- You can bid more aggressively than competitors who only focus on immediate returns since CLV justifies initial spending.
Stop wasting time on generic benchmarks. Build targets based on your margins, AOV, and lifetime value to apply insights most relevant to your business model.
Tools like Trendtrack segment customers by lifetime value automatically. This helps you set differentiated ROAS targets for first-time buyers versus repeat customers. The data-driven approach replaces guesswork with precision.
{{cta-1}}
13 tactics to improve ROAS and scale profitably
Improving ROAS isn't about applying random best practices. It's about implementing proven tactics in the right order. The strategies that work for a high-margin jewelry brand won't work for a low-margin electronics store.
The difference between profitable scaling and burning cash often comes down to execution details. How you segment audiences, when you switch from manual to automated bidding, or whether you track POAS instead of just ROAS.
1. Leverage first-party data for precision targeting
Use first-party data and behavioral segmentation for targeting. Build prospecting lists from actual customer history, on-site behavior, and email engagement. Avoid broad interest groups.
Exclude recent buyers (180–365 days) from acquisition campaigns. Prioritize high-value cohorts like repeat buyers and customers with high average order value.
Segment your audiences by behavior:
- High-value repeat buyers
- Cart abandoners
- Product viewers
- Channel-specific cohorts
Tailor your messaging accordingly. Offer discounts to cart abandoners. Show social proof to browsers. Give VIP offers to repeat customers.
2. Exclude existing customers and build lookalike audiences
Build high-quality lookalike audiences with proper exclusions. Start with 1% lookalikes using your best customers as seed audiences. Qualify these customers by multiple purchases, high spending, and long retention. Test 2–5% lookalikes to scale after you validate performance.
Maintain clear swim lanes across your campaigns:
- Prospecting excludes purchases from the last 180–365 days
- Retargeting focuses on non-buyers
- Retention serves existing customers only
Audit your exclusion lists monthly. Verify your pixel fires correctly. Avoid overlapping lookalikes. Don't run 1% within 2%.
3. Optimize your ad creative and messaging
Test ad formats systematically and match messaging to landing pages. Launch 4–6 format variations in one ad set:
- Video
- Carousel
- Static with overlay
- Lifestyle shots

Campaign Budget Optimization (CBO) automatically distributes your total campaign budget across ad sets. It increases spend on top performers and reduces it on weaker ones over a 7–14 day learning period.
Track CPA and POAS, not just clicks. Run tests in a separate campaign. Then duplicate winners to scaling campaigns.
Want to dive deeper into what makes ad creative actually convert? Check out our guide on the best ad creatives to see real examples of high-performing formats across industries.
4. Ensure your ad promise matches your landing page
If your ad says "30% off," show it immediately above the fold. Use consistent visuals, headlines, and featured products throughout.

Leverage social proof and user-generated content in ads. Use:
- Specific customer quotes ("Saved me 15 minutes daily" beats "Great product")
- Real review counts and star ratings
- Video testimonials
- User-generated content showing actual customers using products
Authenticity outperforms polished stock images, especially on Instagram and TikTok. Document all test results. Scale what converts, not what looks best.
5. Master your bidding strategy and budget allocation
Start with manual CPC bidding for the first few weeks. This helps you understand which clicks convert. Once you accumulate 30–50 conversions per campaign, switch to Smart Bidding (Target ROAS or CPA). The algorithm then optimizes using real performance data.
For purchase-focused campaigns, prioritize automation that optimizes for conversions at scale. Avoid focusing solely on clicks or impressions.
6. Allocate budget based on performance data and adjust bids by segment.
Analyze 3–4 weeks of performance data to identify patterns across:
- Day and time
- Device and placement
- Audience segments
Increase spend 5–15% during best-performing periods and segments. Bid more aggressively on warm audiences (retargeting, cart abandoners, site visitors). Lower bids on cold prospecting until you validate results.
For CBO campaigns, scale budgets gradually, increase by 15–20% every few days. Use 3–5+ ad sets to let the algorithm reallocate budget effectively.
Trendtrack's performance analytics help you identify these patterns faster by aggregating data across all your ad platforms. Instead of manually pulling reports from Meta, Google, and TikTok, you see which segments and time periods drive the best returns in a unified dashboard.
Want to see how your competitors are optimizing their landing pages and ad creatives? Track competitor ads to discover conversion patterns and messaging strategies that work in your industry.
7. Improve your landing page conversion rates
Optimize landing pages for speed, mobile, and conversion. Load critical content within 3 seconds using tools like PageSpeed Insights.

Ensure mobile optimization with these elements:
- 16px+ text size
- 44x44px buttons
- Lazy-load images below the fold
- Appropriate input types
Simplify checkout to 3–4 steps. Enable guest checkout, add progress indicators, use auto-fill, and include address lookup.
Build trust with specific signals:
- Specific review quotes
- Guarantees (free returns, money-back)
- Payment logos
- User-generated content
Place clear, high-contrast CTAs above the fold and after product details. Test different CTA copy like "Get Mine Now" vs. "Add to Cart" to find what resonates with your audience. Just like this one:
{{cta-2}}
8. Use dynamic retargeting with segmented messaging and optimal timing
Show exact abandoned items within 24 hours using dynamic product ads. Follow up at 48 hours with social proof or free shipping before discounting. Avoid training intentional abandonment.
Segment by engagement level:
- High-intent audiences (cart/checkout): Deploy aggressive retargeting with clear CTAs
- Medium-intent (product views): Deliver educational content addressing objections
- Low-intent (brief visits): Use minimal spend or exclude entirely
Use three-stage messaging:
- Soft reminder highlighting main benefit
- Trust-building with testimonials and reviews
- Urgency or final incentive
Set retargeting windows by audience type:
- Cart abandoners: Retarget for 7–14 days
- General visitors: Retarget for 30 days
Cap frequency at 3–5 impressions per week (maximum 7 for high-intent audiences). Monitor frequency alongside CPA. If frequency rises with costs, expand your audience or refresh your creative.
9. Structure your campaigns for scalable growth
Create separate campaigns for prospecting, retargeting, and retention. Build three distinct campaign types, each with clear exclusions and roles:
Prospecting targets cold audiences. Exclude 180-day visitors and 365-day buyers. Accept a 2:1–3:1 ROAS threshold.
Retargeting focuses on site visitors and add-to-carts using dynamic ads. This delivers your highest ROAS.
Retention targets existing customers from 180–365 days ago. Exclude recent buyers for 30–60 days. This drives cost-effective repeat revenue.
Each campaign serves a specific purpose with appropriate ROAS expectations.
10. Build a testing-to-scaling pipeline for systematic growth.
Maintain a dedicated testing campaign as your lab. Launch 4–6 creatives per ad set. Review performance every 7–14 days.
When an ad shows consistent spend and strong ROAS, duplicate it into a separate scaling campaign. Use a hard duplicate, not a budget increase. Keep the original running in testing for ongoing learning.
Maintain 5–10 proven creatives in your scaling campaign. Let your testing campaign continually discover new winners. This approach ensures you scale only validated performers.
11. Monitor POAS (Profit on Ad Spend) alongside ROAS.
ROAS measures revenue ÷ ad spend. POAS measures profit ÷ ad spend. Here's why they differ:
Example: $100 spend generates $500 revenue with $300 costs = 5:1 ROAS but only 2:1 POAS.
Include all variable costs when calculating profit: COGS, shipping, payment processing fees, fulfillment, returns, and service fees. Two campaigns with equal ROAS can deliver very different profits.
Allocate budget based on what produces profit, not just revenue. Track channels with lower short-term ROAS that may deliver superior long-term POAS and retention.
With Trendtrack you can calculate POAS by integrating your cost data with platform revenue numbers. This makes it easy to identify which campaigns generate actual profit versus just impressive revenue numbers.
12. Apply Google Ads strategies for high-intent search traffic
Use exact-match keywords and search query reports to shift budget toward converting terms. Add negative keywords to block irrelevant traffic. For example, a premium brand should block "cheap" or "free."
Use RLSA (remarketing lists for search ads) to bid more aggressively on site visitors and cart abandoners. This captures bottom-funnel searches effectively.
13. Optimize Meta and emerging platforms with native, authentic content
On Facebook and Instagram, separate ad campaigns by funnel stage. Assign distinct budgets and ROAS targets to each stage. Track lifetime value by cohort. Invest more in acquiring similar customers.
Tools like Trendtrack turn raw data into actionable segmentation lists you can act on immediately. This helps you identify your highest-value customer segments and build precise lookalike audiences that actually convert.
For TikTok, create organic entertaining videos or video animations with quick cuts and trending audio. Boost top performers and partner with creators whose followers match your customer profile.
Set appropriate expectations for platform performance:
- TikTok: ~2.5 ROAS
- Meta: ~8–10 ROAS
- Pinterest/Twitter: ~2.7 ROAS
Treat lower-ROAS platforms as awareness channels rather than direct conversion drivers.
Different platforms deliver vastly different ROAS benchmarks. Understanding what's realistic for each channel is crucial before optimizing. Learn more about Facebook ads ROAS benchmarks to set targets that match your platform mix.
Conclusion
Improving ROAS isn't about chasing a magic number. It's about building a profitable, scalable advertising system that aligns with your business model and growth stage.
Forget industry benchmarks. Calculate your breakeven ROAS based on actual margins and costs. Then build toward targets that make sense for your business stage and customer lifetime value.
The 13 tactics in this guide work. But only when applied strategically. Start with precision targeting and proper campaign structure. Layer in creative optimization and dynamic retargeting. Track POAS, not just ROAS, to see real profitability.


.avif)
Ready to build a millions dollars brand ?
.avif)
