What is the Average ROAS for Facebook Ads in 2025?


The average Facebook ads ROAS across all industries in 2025 is 2.19:1. Meaning every dollar spent returns $2.19 in tracked revenue. However, this benchmark alone doesn't determine profitability.
Return on Ad Spend (ROAS) measures how much revenue your advertising generates for every dollar spent. It's one of the most commonly tracked metrics in digital advertising, but it's often misunderstood.
The basic formula: ROAS = Revenue from ads / Cost of ads
If you spend $1,000 on Facebook ads and generate $4,000 in revenue, your ROAS is 4:1 (often written as 4x). This means each ad dollar returned $4.
ROAS matters because it provides a quick snapshot of campaign efficiency. However, revenue is not profit. It is a critical distinction and we'll explore it throughout this guide.
The Average Facebook Ads ROAS
The 2025 Facebook average ROAS benchmark is 2.19:1 for all industries combined. This figure represents tracked revenue data from hundreds of ecommerce sectors.
This benchmark combines data from Q4 2024 through Q1 2025, analyzing conversion tracking across multiple attribution windows. The figure represents the median ROAS to avoid skewing from extreme outliers.
Why different businesses get different ROAS
This average masks significant variation because it combines:
- High-margin luxury goods (3.7:1+ ROAS)
If you sell designer handbags with 80% profit margins, you can afford to spend more on ads and still get strong returns
- Thin-margin dropshipping (2.0:1 ROAS)
If you're dropshipping products with only 20-30% margins, every ad dollar counts more. So you need tighter efficiency (though you may need even lower acceptable ROAS to remain competitive)
- Long-cycle purchases like real estate (2.1:1 ROAS)
Big-ticket items with long decision-making periods often show lower immediate ROAS. Because the sales process is extended over weeks or months
- Quick-turn baby products (3.71:1 ROAS)
Fast-moving consumer goods with repeat purchases can achieve higher ROAS because of impulse buying and strong emotional triggers
When you average all Facebook ad performance across different industries, you're mixing completely different business models. The 2.19:1 figure hides massive differences between business types.
Industry-by-industry ROAS benchmarks
As we mentioned above, ROAS varies dramatically by category. You can use these benchmarks to set realistic expectations:
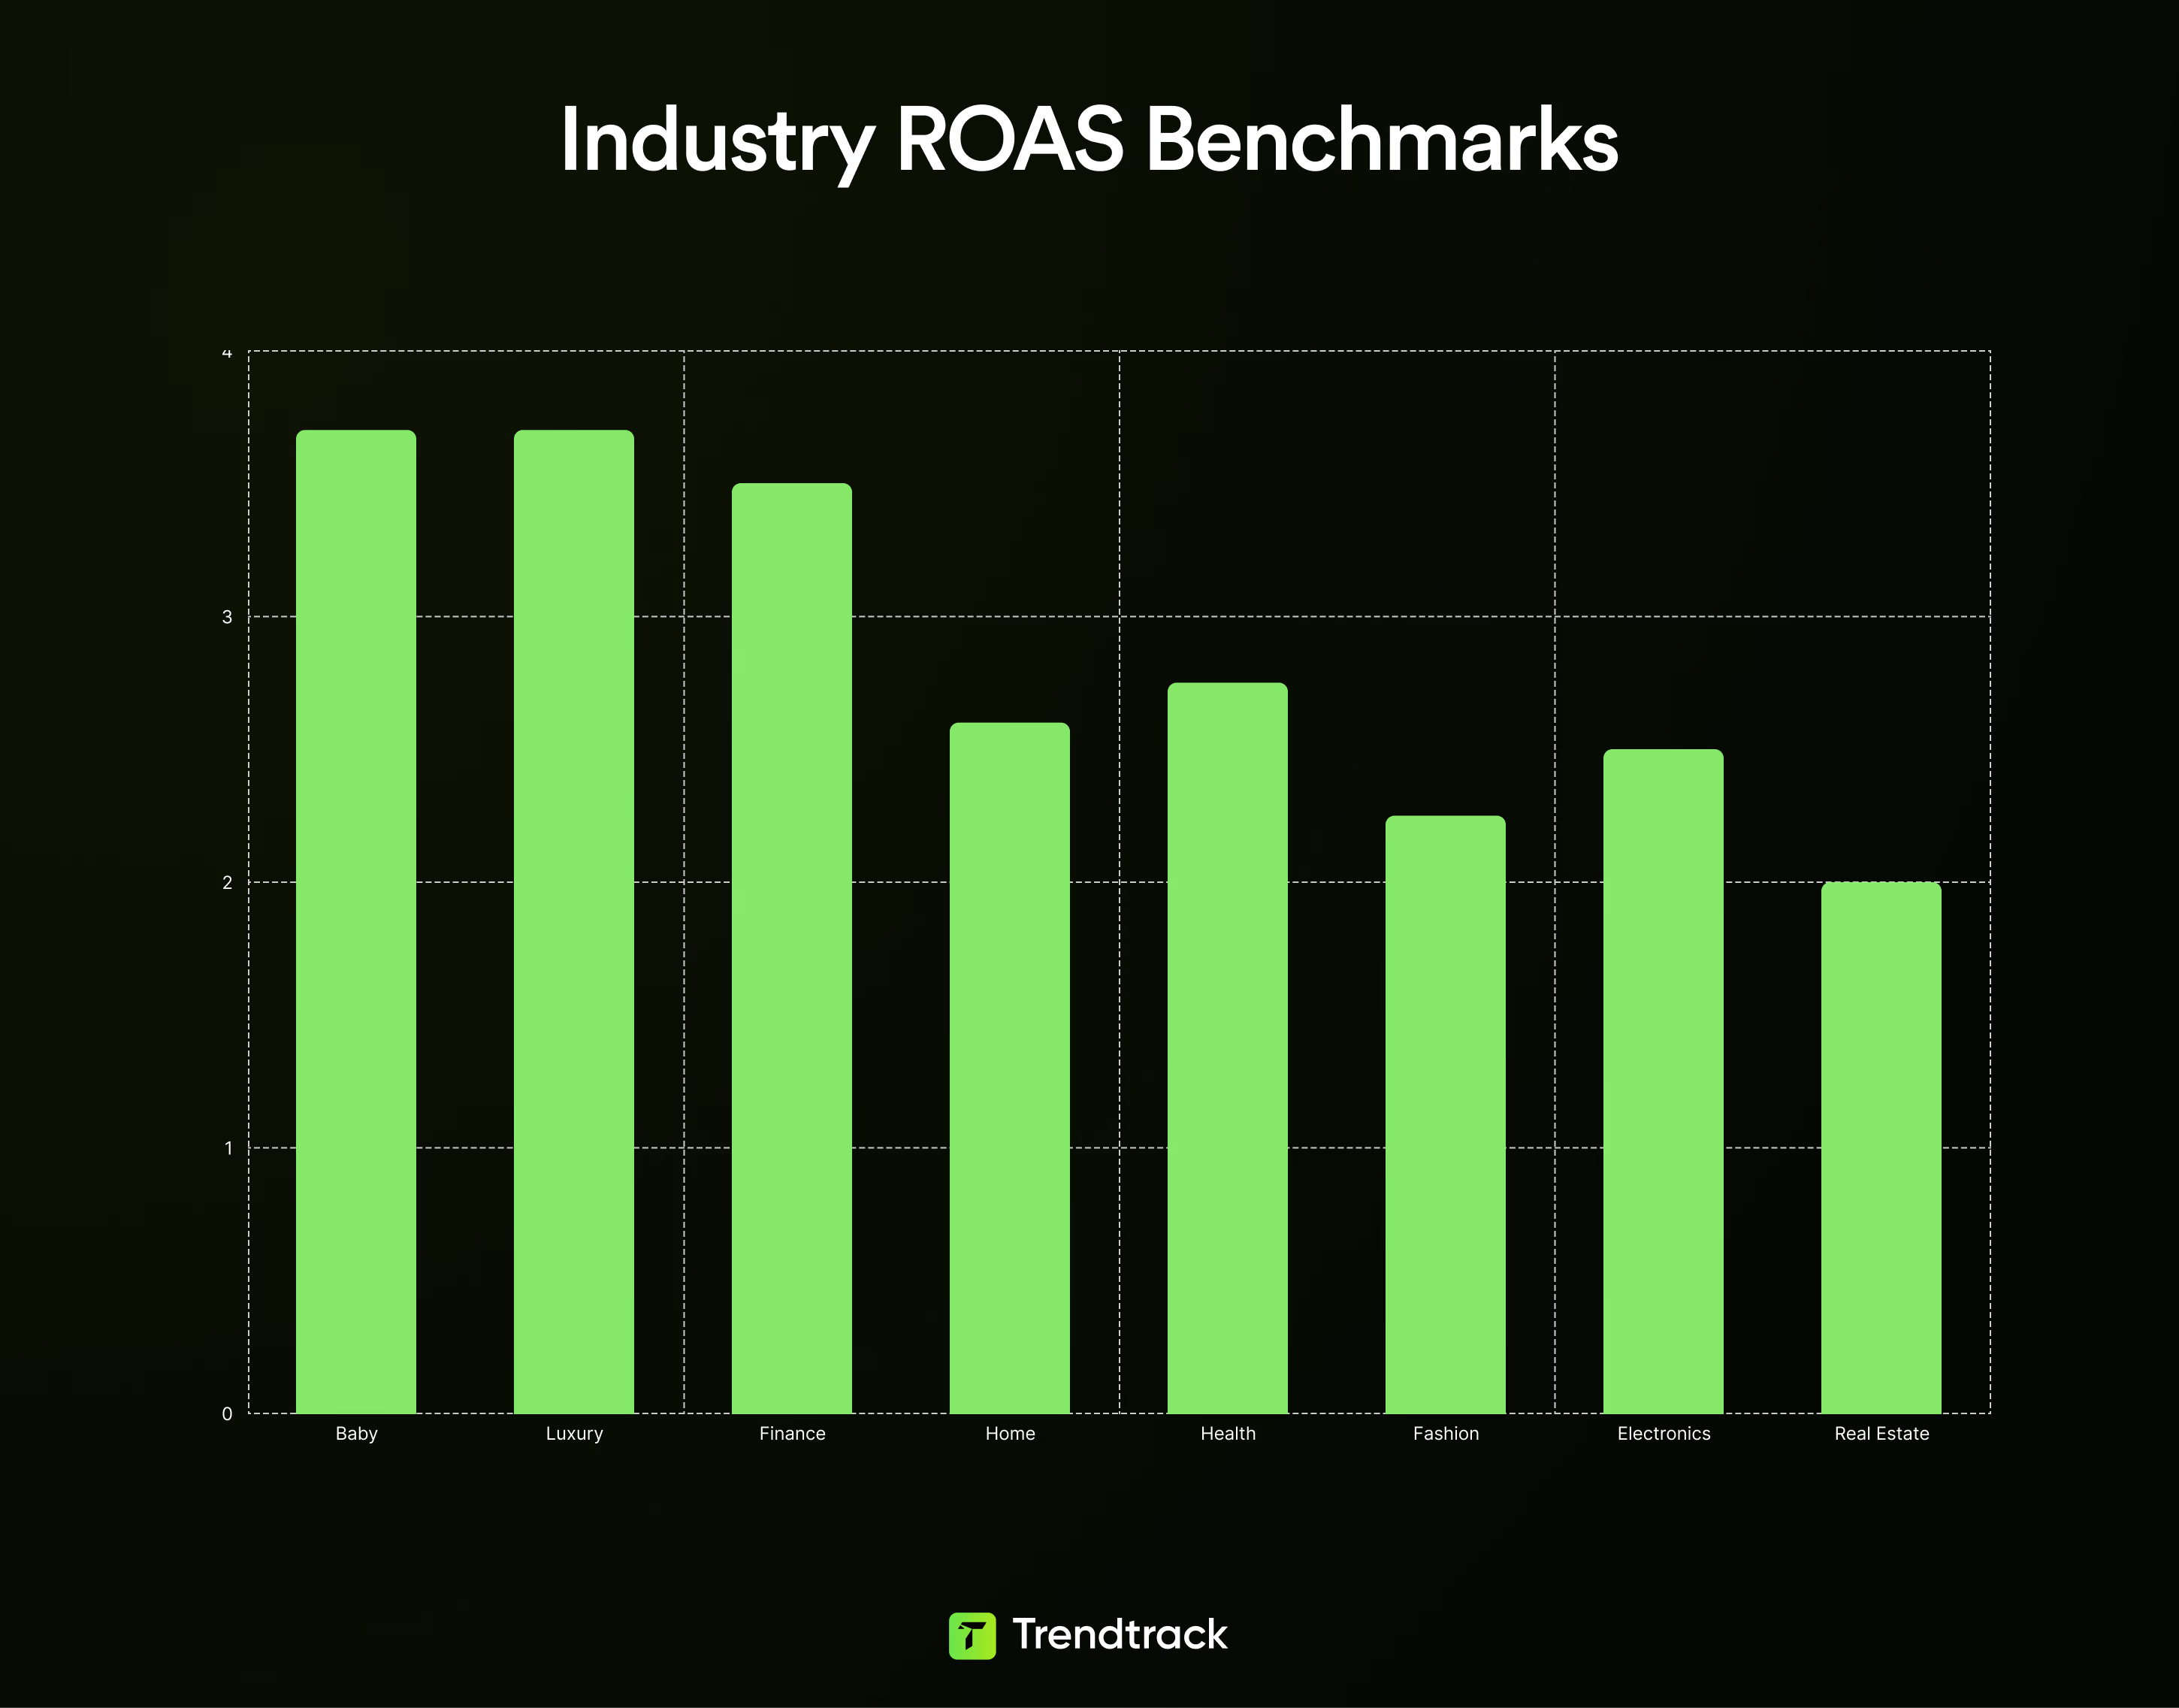
- Baby Products (3.52:1 ROAS)
Parents buy quickly with high urgency and strong emotional triggers. Repeat purchases are common as babies constantly need new products. This makes it one of the highest-performing categories on Facebook.
- Finance & Insurance (3.50:1 ROAS)
High lifetime value justifies the acquisition cost in this industry. Complex sales cycles with multiple touchpoints mean the initial ad spend pays off significantly over time through policy renewals. And of course cross-selling opportunities.
- Luxury Goods (3.70:1+ ROAS)
High ticket prices and profit margins allow luxury brands to maintain strong ROAS. Aspirational purchasing behavior and less price sensitivity mean customers are willing to pay premium prices. This is what makes the ad spend highly efficient.
- Health & Beauty (2.31:1 ROAS)
This category requires significant social proof and has longer decision cycles. High competition for ad space drives up costs, but repeat purchase potential and subscription models help maintain profitability.
- Consumer Electronics (3.67:1 ROAS)
Research-heavy buyers take time to make decisions, leading to longer consideration periods. However, high average order values offset the lower ROAS, making campaigns still profitable despite extended sales cycles.
- Real Estate (2.10:1 ROAS)
Extremely long sales cycles mean ads generate leads rather than immediate sales. Performance is measured over months, not days. The high transaction value justifies the lower ROAS and extended timeline.
- Fashion & Apparel (3.65:1 ROAS)
Seasonal fluctuations, high return rates, and intense competition characterize this market. Fashion brands must navigate trends and sizing issues while competing in one of Facebook's most crowded advertising spaces.
- Home & Garden (3.86:1 ROAS)
A mix of impulse and considered purchases creates variable performance. Lower-priced decorative items convert quickly, while furniture and major home improvements require longer decision-making periods.
Note: These figures represent median ROAS across campaigns, not top performers. Well-optimized campaigns in any category can achieve 2-3× these benchmarks.
Use ad spy tools to analyze high-performing stores in your niche. See their ad spend, traffic patterns, and identify which campaigns are scaling successfully.
If your category's average ROAS appears unprofitable:
- Check your break-even ROAS first—high margins may make lower ROAS profitable
- Consider customer lifetime value—repeat purchases change the economics
- Analyze top competitors—if they're scaling aggressively, economics likely work
- Test attribution windows—7-day vs. 28-day can show different pictures
B2B vs. B2C: different games, different rules
The same 2:1 ROAS means completely different things depending on your business model. Understanding whether you're in B2C, B2B, or a hybrid model is critical for evaluating Facebook ad performance.
B2C ecommerce ROAS
B2C ecommerce operates on speed. Someone sees your ad for a water bottle, clicks, and buys within hours. This immediate feedback loop makes optimization straightforward, you can test creative on Monday and know if it works by Friday.
Typical B2C ROAS ranges from 2:1 to 5:1, with dramatic seasonal swings. Holiday Q4 peaks at 4-5:1 as consumers actively shop, then crashes to 2-2.5:1 in January and February when wallets tighten. By summer, most categories stabilize around 3-3.5:1.
Optimization focuses on rapid testing. Creative refreshes, audience segmentation, and real-time budget adjustments based on daily performance.
The economics of B2C ecommerce differ dramatically from B2B and subscription models. If you want a deeper breakdown of what is a good ROAS for ecommerce, take a look!
B2B Lead Generation
B2B advertising lives in a different universe. You're not selling a $30 product, you're generating leads for contracts worth thousands. Purchase decisions involve multiple stakeholders and sales cycles stretching weeks or months.
Your immediate ROAS will look terrible. A SaaS company spending $5,000 to generate 100 leads at $50 each might convert only 5 leads to $2,000 customers. This shows just 2:1 ROAS initially.
But if those customers stay for 3 years at $2,000/year, the true ROAS becomes 6:1. You just won't know this for years.
B2B marketers focus on cost per lead, lead quality scores, and sales team feedback about which leads actually close, not immediate revenue numbers.
Hybrid Models: Subscriptions & Trials
Subscription businesses like meal kits, software trials, subscription boxes inherit challenges from both worlds. First-order ROAS looks disastrous at 0.8:1 to 1.5:1 because you're losing money on initial acquisition.
This is where cohort tracking matters. Month one shows 0.9:1 ROAS (losing money). Month three hits 2.1:1 (breaking even). Month six reaches 4.5:1 (profitable). Month twelve shows 8.2:1 as retention compounds.
Break-even ROAS vs. target ROAS
Most advertisers obsess over hitting a "good" ROAS number without understanding the one number that actually matters. Their break-even point. Break-even ROAS tells you the minimum return needed to avoid losing money. Here is how to calculate break even ROAS.
Break-even ROAS is simple math based on your profit margin:
Break-Even ROAS = 1 ÷ Profit Margin
Here's why this matters. Imagine you run a dropshipping store selling phone cases for $40 each. After accounting for the product cost $20, shipping $8, payment processing fees $1.20, and platform fees $3, you have $7.80 left from each sale. Your profit margin is 19.5% ($7.80 ÷ $40).
Your break-even ROAS = 1 ÷ 0.195 = 5.13:1
This means you need to generate $5.13 in revenue for every dollar spent on ads just to break even. A "great looking" 4:1 ROAS would actually be losing you money on every sale.
Now compare this to a premium skincare brand selling moisturizer for $100. Their product costs $25, shipping is $5, and fees total $3. They have $67 profit per sale, a 67% margin.
Their break-even ROAS = 1 ÷ 0.67 = 1.49:1
This brand only needs $1.49 in revenue per ad dollar to break even. A 3:1 ROAS that would bankrupt the dropshipper generates healthy profits for the skincare brand.
Want to calculate your exact break-even point without the math? Use our break-even ROAS calculator to instantly see what return you actually need based on your margins.
Set Realistic Target ROAS
Breaking even isn't the goal. You need profit to reinvest and grow. Your target ROAS should sit well above your break-even point. Most businesses aim for 1.5-2× their break-even ROAS during testing phases, and 2-3× when scaling profitably.
Let's return to our dropshipping example with a 5.13:1 break-even ROAS. During initial testing, you'd target 7-8:1 ROAS (1.5× break-even). Once you've proven the product works, you'd aim for 10-15:1 ROAS (2-3× break-even) when scaling.
The skincare brand with 1.49:1 break-even would target 2-2.5:1 ROAS during testing and 3-4.5:1 ROAS when scaling.
This is why comparing your ROAS to industry averages or competitors is often meaningless. Your margins determine everything.
Critical factors impacting your Facebook ROAS
Your ROAS doesn't exist in a vacuum. It's shaped by platform changes, market conditions, and dozens of campaign decisions.
Understanding these factors helps you diagnose why your ROAS is lower than expected. Some you can control through optimization, while others require adapting your strategy to external realities.
1. iOS Privacy Rules & Attribution Loss
Apple's privacy changes have broken Meta's ability to track all conversions accurately. Mobile-heavy businesses see 20-30% attribution loss. This means purchases show up as "direct" or "organic" when they actually came from Facebook ads.
Your dashboard ROAS might look lower than reality or you're missing sales entirely. To verify what's happening, compare ad activity spikes to actual store revenue increases.
If they align, attribution is working. If not, implement Conversions API alongside your pixel and use URL parameters to track campaigns properly.
2. Campaign Objectives Determine ROAS Outcomes
Different campaign objectives produce wildly different ROAS. Remarketing to cart abandoners delivers 6:1 to 12:1 ROAS. Warm audience conversions show 4:1 to 8:1. Cold audience campaigns drop to 2:1 to 4:1. Traffic and awareness campaigns might only hit 0.8:1 to 2:1 ROAS.
The critical mistake is killing low-ROAS awareness campaigns while celebrating high-ROAS remarketing. You need both. Remarketing only works if you have traffic to remarket to. Allocate 40-50% of budget to cold prospecting, 30-40% to warm conversions, and 20-30% to hot remarketing.
3. Audience Targeting Quality
Bad targeting spreads budget across people who'll never buy. Good targeting builds specific personas with layered interests and demographics.
Test 3-5 tight audience segments in parallel with identical creative. After 7-14 days, scale winners and kill losers. If you're targeting 10+ segments simultaneously, you're spreading budget too thin for meaningful data.
4. Creative Performance & Ad Fatigue
Creative follows a predictable lifecycle. Days 1-7 perform strong. Days 8-30 plateau as audiences saturate. Days 31+ decline as fatigue sets in.
Launch 3-5 creative variants per campaign. Monitor frequency (keep under 3 impressions per user per week). Refresh creative every 30-45 days. If your ad has run 60+ days with declining ROAS, it's fatigued—time to refresh.
5. Landing Page Experience
Your landing page messaging must align closely with your ad copy. When visitors click your ad, they should immediately recognize the same offer, tone, and value proposition. This consistency is crucial for maintaining trust and momentum toward conversion.
Your ROAS depends on the entire journey, not just the ad. A landing page with 4-second load time might deliver 2.1:1 ROAS. The same ad with a 1.5-second optimized landing page hits 3.4:1 ROAS.
Common issues destroying your ROAS include ad promises that don't match what visitors see on the landing page, creating immediate friction. Confusing visitors with too many calls-to-action also drives them away before they convert.
Requiring account creation before purchase or surprising customers with shipping fees at checkout can kill momentum. Finally, failing to show trust signals like reviews or money-back guarantees makes buyers hesitate.
6. Seasonal Fluctuations
ROAS follows predictable annual patterns. January-February slumps to 1.8-2.2:1 post-holiday. Spring recovers to 2.3-2.8:1. Summer varies at 2.0-2.6:1. Fall jumps to 2.5-3.2:1. November-December peaks at 3.5-5:1.
Don't panic when ROAS drops in January, it's expected. Accumulate cash during Q4 to sustain Q1-Q2 growth. Test in low-season months when CPMs are cheaper. Scale aggressively in Q4.
7. Competitive Intensity & Auction Dynamics
More advertisers means higher CPMs which means lower ROAS. Monitor competitor ad volume in Facebook Ad Library and watch their promotional cadence.
Monitor competitor ad volume and promotional cadence using Trendtrack's Ad Library. Track when competitors launch new campaigns, what creative angles they're testing, and how long their winning ads run.
Want to systematize this competitive intelligence gathering? Learn how to track competitor Facebook ads at scale and spot winning patterns before your rivals do.
How to Calculate Estimated Competitor ROAS with Trendtrack
You can't see a competitor's exact ROAS of course. However, Trendtrack gives you the tools to estimate their Facebook ads if are profitable.
Estimate ROAS from Ad Spend and Traffic Data
For stores in EU & UK markets, Trendtrack shows actual ad spend and impressions. Cross-reference this with their traffic data to estimate performance.
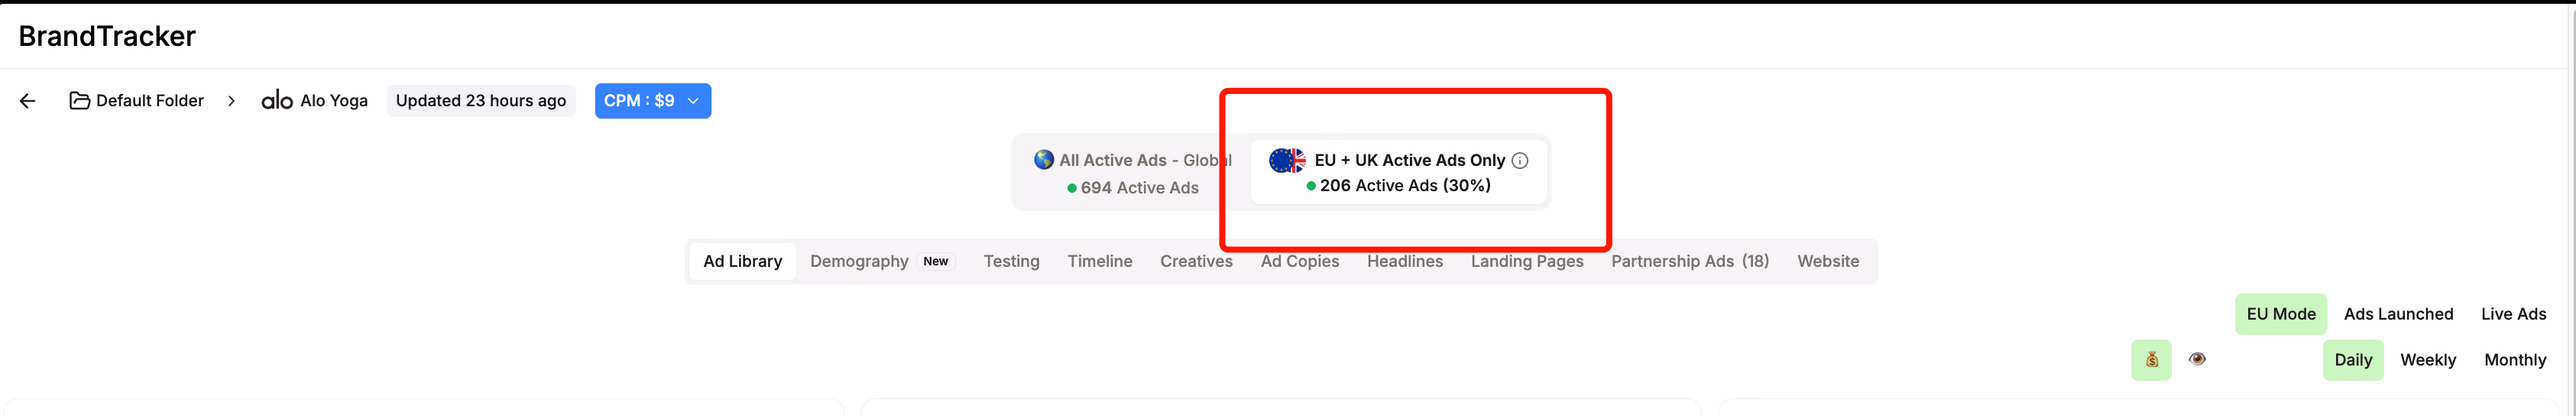
Here's how. If a competitor spends $10,000 on Facebook ads in the last 30 days and their monthly traffic increased by 50,000 visits, you can estimate their CPM at $0.20. Let's say our brand is Alo Yoga. Filter the Trending Ads page with the keyword.

Then numbers.

Check their monthly visits from Trending Shops.

If their average order value is visible through product pricing and their conversion rate aligns with the industry average of 2–3%, bingo! You’ve got a clear picture of a profitable setup. You can reverse-engineer approximate ROAS.
Example: 50,000 visits × 2.5% conversion rate = 1,250 orders. If their average product price is $40, that's $50,000 revenue against $10,000 ad spend = 5:1 ROAS estimate.
Use Scaling Signals as ROAS Indicators
The most reliable ROAS indicator is scaling behavior. Stores don't increase ad spend on unprofitable campaigns. Use Brandtracker to track a competitor's ad count over time.
If a store goes from 20 active Facebook ads to 80 over 60 days while traffic climbs steadily, it’s a clear signal. They’ve found profitable ROAS. They're scaling winners. If ad count stays flat or decreases while they keep testing new creative, they're struggling to find profitable campaigns.
The Ads Launched Trend chart in Brandtracker shows this visually. Consistent upward trends in both ads launched and ads still running indicates strong ROAS performance.
Identify High-ROAS Products by Ad Concentration
Products with the best ROAS get the most ad spend. In Trending Shops tab, look for products with 10+ different ads pointing to them. Especially if those ads have been running for weeks.
If a competitor runs 15 variations of Facebook ads all pointing to one product page, it signals strong testing activity. If several of those ads have been live for 30+ days, that product likely delivers at least a 3:1 ROAS. Stores don't spend that much creative and ad budget on marginal performers.
Calculate Your Own ROAS Goals from Market Data
Once you've identified successful competitors in your niche, use their behavior to set realistic ROAS targets. If top performers in your category consistently run 40–60 active Facebook ads, it shows they can sustain a large testing budget.
Plus, if they also maintain steady traffic growth, reverse-engineer what margins and ROAS make that level of spending sustainable.
Use Trendtrack to find their average product prices, estimate their costs based on similar products, calculate likely margins. Then determine what ROAS would justify their ad spend levels. This gives you data-driven targets instead of guessing.
If three competitors in your niche all maintain 50+ active ads while scaling traffic their sustained activity proves certain ROAS levels are achievable. Model your targets accordingly.
{{cta-1}}
Facebook ROAS vs. Other Advertising Platforms
Understanding how Facebook compares to other channels helps you allocate budget strategically and set realistic expectations. Facebook's average ROAS of 10.68:1 sits in the middle of the platform spectrum. However, that number alone doesn't tell you which platform is right for your business.

Google Ads leads at 13.76:1 ROAS because it captures high buyer intent—people actively searching for solutions. When someone types "buy running shoes," they're ready to purchase.
This makes Google expensive (CPCs often $2-10+) but efficient for capturing existing demand. It works when you have a recognized brand, clear search terms, and margins supporting premium click costs.
Facebook at 10.68:1 operates on targeted interruption, not active search. You're showing ads to people who aren't looking for your product right now but match the profile of someone who might want it.
This makes Facebook ideal for building demand, launching new products people don't know to search for, and testing product-market fit through visual storytelling.
Instagram (8.83:1 ROAS) functions as a discovery platform. Users save and explore content but don't buy immediately. Advertisers use Instagram for awareness. Then retarget engaged users on Facebook with conversion-focused ads for higher combined ROAS.
Amazon Ads (7.95:1) captures very high shopping intent, but competition is intense and Amazon owns the customer relationship. TikTok (2.50:1), Pinterest (2.70:1), and Twitter/X (2.70:1) cluster at lower ROAS.
TikTok requires viral content for younger audiences. Pinterest attracts long-consideration purchases like home decor. Twitter serves B2B thought leadership with limited ecommerce success.
Understanding your competitors' platform strategy gives you an edge. Trendtrack's Brandtracker lets you monitor specific stores to see their complete ad library and which creatives they're scaling. This helps you benchmark your ROAS against real competitors, not just industry averages
{{cta-1}}
When "Good" ROAS Actually Means You're Losing Money
Short-term ROAS can be misleading for subscription or repeat-purchase businesses. A subscription coffee company might show terrible first-order economics. $30 product price, $20 product and shipping cost, $25 ad spend per customer equals 1.2:1 ROAS. Looks like a disaster.
But if the average customer stays 8 months at $30 monthly revenue, lifetime revenue hits $240. That makes lifetime ROAS 9.6:1—excellent. The key is knowing your retention rates by acquisition channel.
Facebook customers might retain at 60% while Google customers retain at 75%. This dramatically changes acceptable first-order ROAS for each channel.
Using POAS Instead of ROAS
Profit on Ad Spend (POAS) measures actual profit, not revenue.
The formula is simple: Gross Profit ÷ Ad Spend.
If you spend $1,000 on ads generating $5,000 revenue but COGS and costs total $4,000, your gross profit is $1,000 and POAS is 1:1.
That 5:1 ROAS with 1:1 POAS means you broke even, every ad dollar generated one dollar in profit.
Target 1:1 POAS to break even, 2:1 POAS for healthy growth, and 3:1+ POAS for excellent scaling opportunities. Top ecommerce brands are shifting from ROAS to POAS as their primary KPI. Because it reflects actual business health, forces you to include all costs, and makes scaling decisions obvious.
How to Calculate ROAS for Your Facebook Campaigns
ROAS calculation is straightforward. It's the interpretation that gets tricky. The formula is simply revenue from ads divided by cost of ads, giving you a ratio that shows how many dollars in revenue each ad dollar generates.
Let's start with a simple example. You spend $1,000 on Facebook ads over a week. Your store generates $4,000 in tracked revenue during that period. Your ROAS is $4,000 ÷ $1,000 = 4:1 (often written as 4x). This means every dollar spent on ads returned four dollars in revenue.
If you spend $500 and generate $1,750 in sales,
your ROAS is $1,750 ÷ $500 = 3.5:1.
If you spend $2,500 and generate $7,000 in sales,
your ROAS is $7,000 ÷ $2,500 = 2.8:1.
The calculation itself is simple arithmetic. The complexity comes from understanding what these numbers actually mean for your profitability.
Why Revenue ≠ Profit: A Real Example
This is where most advertisers get dangerously misled. ROAS measures revenue, not profit. You can have strong ROAS while bleeding cash because revenue doesn't account for any of your other costs.
Consider selling a T-shirt for $30. You spend $300 on Facebook ads and generate $900 in revenue from 30 shirt sales. Your ROAS is 3:1—looks great at first glance.
But here's the complete picture. Each shirt costs $18 to purchase from your supplier. Shipping costs $4 per shirt. Payment processing takes 3% ($27 total). Your ecommerce platform charges $18 in monthly fees allocated to this campaign.
The math tells the real story. Product costs: $18 × 30 shirts = $540. Shipping: $4 × 30 shirts = $120. Payment processing: $27. Platform fees: $18. Ad spend: $300. Total costs: $1,005. Total revenue: $900. You lost $105 despite what looked like a profitable 3:1 ROAS campaign.
This is the revenue trap. The ROAS metric deceived you into thinking you were succeeding when you were actually losing money on every sale. Without understanding your complete cost structure, ROAS is just a vanity metric.
Revenue Attribution Challenges on Facebook
Attribution adds another layer of complexity because customer journeys involve multiple touchpoints. Facebook uses a 7-day click, 1-day view attribution window by default, but actual purchase paths are rarely that clean.
Here's a common scenario. Monday, a customer sees your ad on mobile Instagram and scrolls past. Tuesday, they remember your brand, click the ad, browse your site for 10 minutes, but don't buy.
Wednesday, they Google your brand name directly, visit your site, and add items to cart. Thursday, they return directly by typing your URL, complete the purchase.
Who gets credit for this sale? Facebook claims it. Because the customer clicked an ad within the 7-day window, even though Google and direct traffic played significant roles.
This is why multi-touch attribution models often reveal 20-40% lower ROAS than single-platform dashboards suggest. Because platforms are crediting themselves for conversions that involved multiple marketing touches.
The solution is cross-referencing your data sources. If Meta Ads Manager shows $10,000 in attributed revenue but your Shopify store only grew by $6,000 during that period, your true ROAS is lower than reported.
Always compare platform reporting against your actual store revenue to understand real performance, not just what Facebook's attribution model claims.
Conclusion
The 2.19:1 average Facebook ROAS is just a starting point, not your target. What matters is your break-even ROAS based on your actual margins, then aiming 1.5-3× above that for profitable growth.
A 5:1 ROAS can lose money with thin margins, while a 2:1 ROAS can be highly profitable with strong margins. Track POAS instead of ROAS to measure actual profitability, not just revenue.
The most successful advertisers study what's working in their niche. Use Trendtrack to analyze top-performing stores. See which ads they're scaling, and understand what ROAS levels actually work in your category.


.avif)
Ready to build a millions dollars brand ?
.avif)
