TikTok Ads Library
TikTok Ads Library is a free tool to explore competitor ads on TikTok. Discover how to use it to find winning creatives and boost your ad strategy.
Updated on September 8, 2026
A free, publicly accessible database that allows anyone to search and analyze active and historical ads running on TikTok providing transparency into what brands, competitors, and creators are advertising on the platform.
Unlike traditional competitive research that requires manual observation or third-party spy tools, the TikTok Ads Library gives direct, native access to TikTok's own ad inventory no subscription required, no data scraping, no approximation. The data comes directly from TikTok itself.
What the TikTok Ads Library Contains?
The library indexes ads that have run on TikTok across markets and categories, with each entry typically containing:
Creative content: the actual video ad as it appeared to users on the platform, viewable directly within the library interface.
Advertiser information: the brand or account name running the ad, allowing direct identification of competitors and category players.
Ad performance indicators: engagement signals including like counts, comment counts, and share counts that provide a proxy for creative performance without access to the advertiser's actual campaign data.
Run dates: the period during which the ad was active, revealing campaign timing, seasonal patterns, and how long specific creatives have been running.
Industry and region filters: allowing searches to be narrowed by product category, geographic market, and time period to surface the most relevant competitive intelligence.
How to Use the TikTok Ads Library?
The library is accessible at ads.tiktok.com/business/creativecenter and requires no login for basic browsing. The search and filter functionality allows users to find ads by:
Keyword: searching for specific terms that appear in ad captions, descriptions, or identified within video content.
Industry category: filtering by vertical to see what competitors in a specific sector are running, from fashion and beauty to electronics and food and beverage.
Region: narrowing results to specific countries or markets, useful for brands operating across multiple geographies or researching market-specific creative strategies.
Time period: filtering by when ads were active to identify seasonal patterns, promotional timing, and how long-running specific creatives are a key signal of profitability.
Objective: filtering by campaign objective to see ads specifically optimized for reach, traffic, or conversions.
Why Long-Running Ads Are the Most Valuable Signal?
The most commercially significant insight available in the TikTok Ads Library is not which ads look the most polished it is which ads have been running the longest.
An advertiser only keeps a TikTok ad live if it is generating a positive return. A creative that runs for 30, 60, or 90 days is almost certainly profitable otherwise the budget would have been reallocated to a better-performing variant. Short-running ads are tests. Long-running ads are winners.
When researching competitor creative strategy, filtering for ads with the longest run duration surfaces the highest-confidence winning creatives in any given category the ones worth studying for format, hook, messaging angle, and offer structure.
What the TikTok Ads Library Reveals?
Creative trends by category: identifying which video formats, hooks, and content styles are gaining traction in a specific industry at a given moment. If multiple competitors in a category are running talking-head UGC ads with a problem-solution structure, that format is likely performing well for the audience.
Competitor promotional calendars: ad run dates reveal when competitors activate paid campaigns, which seasonal moments they prioritize, and how aggressively they advertise around key retail events like Black Friday or holiday seasons.
Offer and messaging angles: analyzing the copy, captions, and on-screen text of high-performing competitor ads reveals which value propositions, pain points, and CTAs are resonating with the target audience.
Creative volume and testing cadence: the number of active ads from a single advertiser indicates how aggressively they are testing creative and how sophisticated their content production operation is. A brand running 50 simultaneous ad variants is testing at a fundamentally different scale than one running five.
New entrants and category disruption: monitoring which new brands are increasing their TikTok ad presence in a category provides early warning of competitive threats before they manifest in market share data.
TikTok Ads Library vs. Third-Party Spy Tools
The TikTok Ads Library provides native, first-party access to TikTok's own ad data which is both its greatest strength and its primary limitation:
What it does better than spy tools the data is official and directly sourced from TikTok, meaning it is accurate and current. There is no risk of data scraping errors, coverage gaps, or outdated information. It is also free, with no subscription cost.
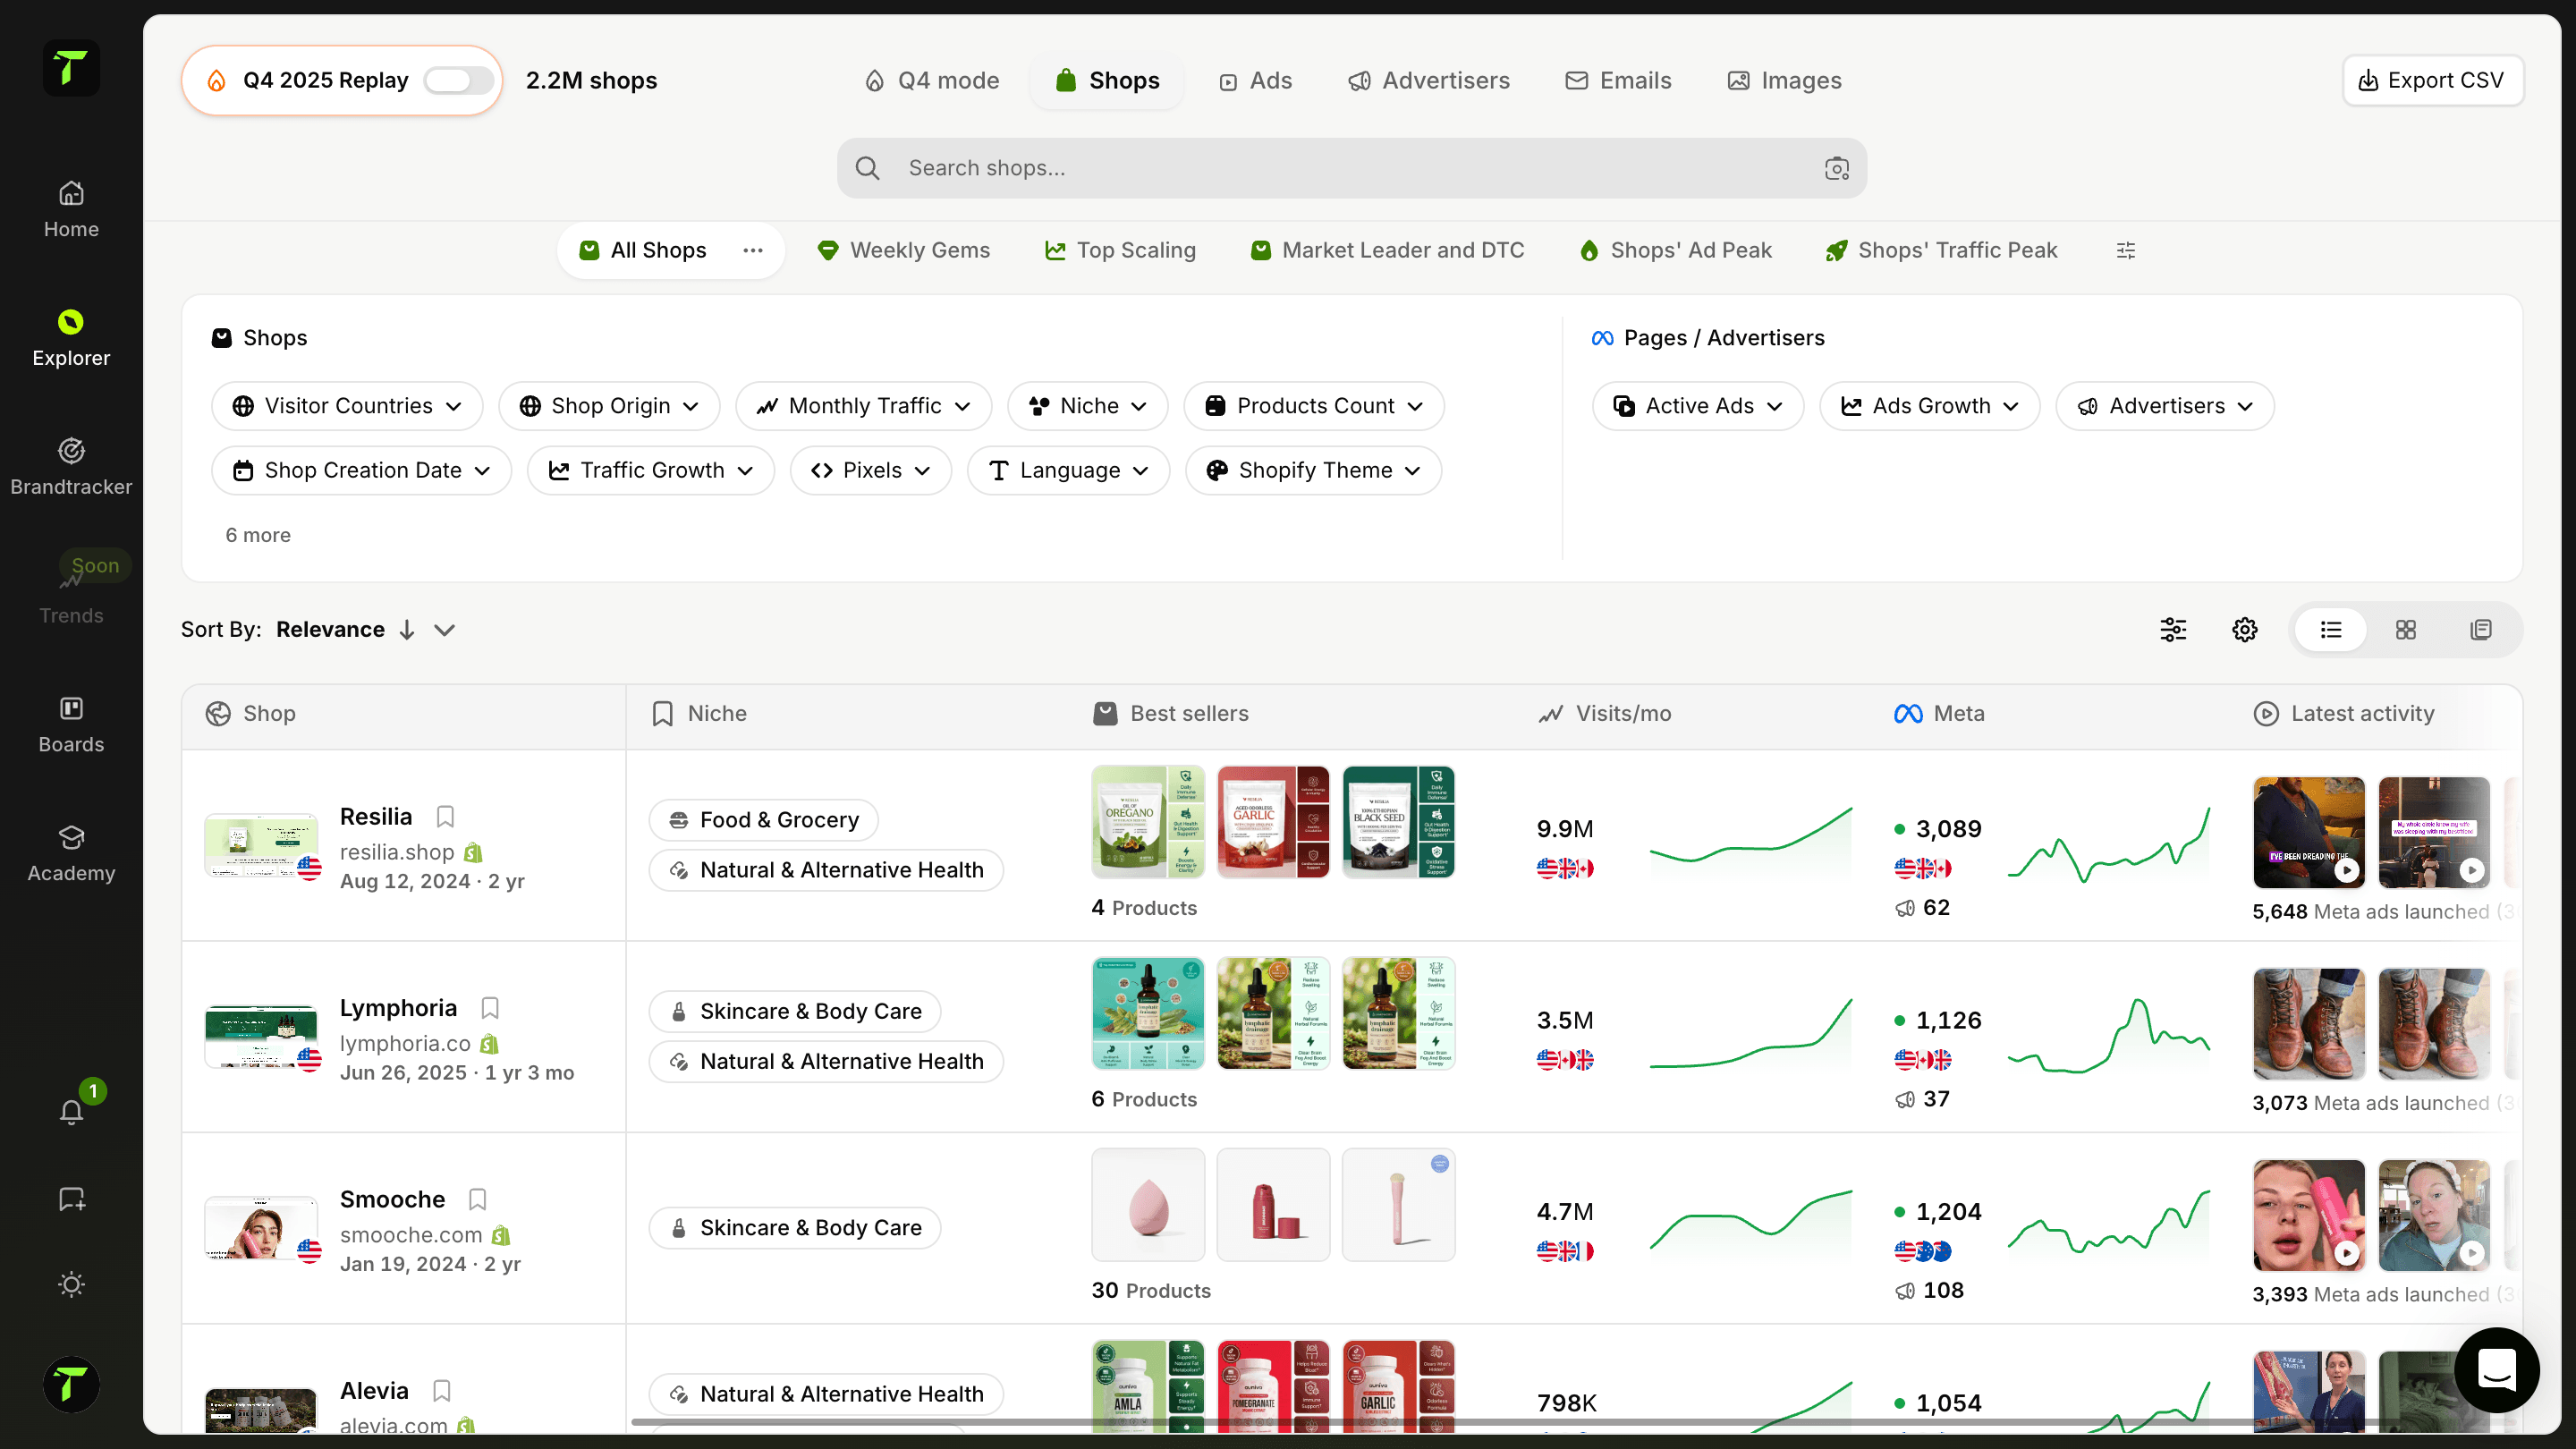
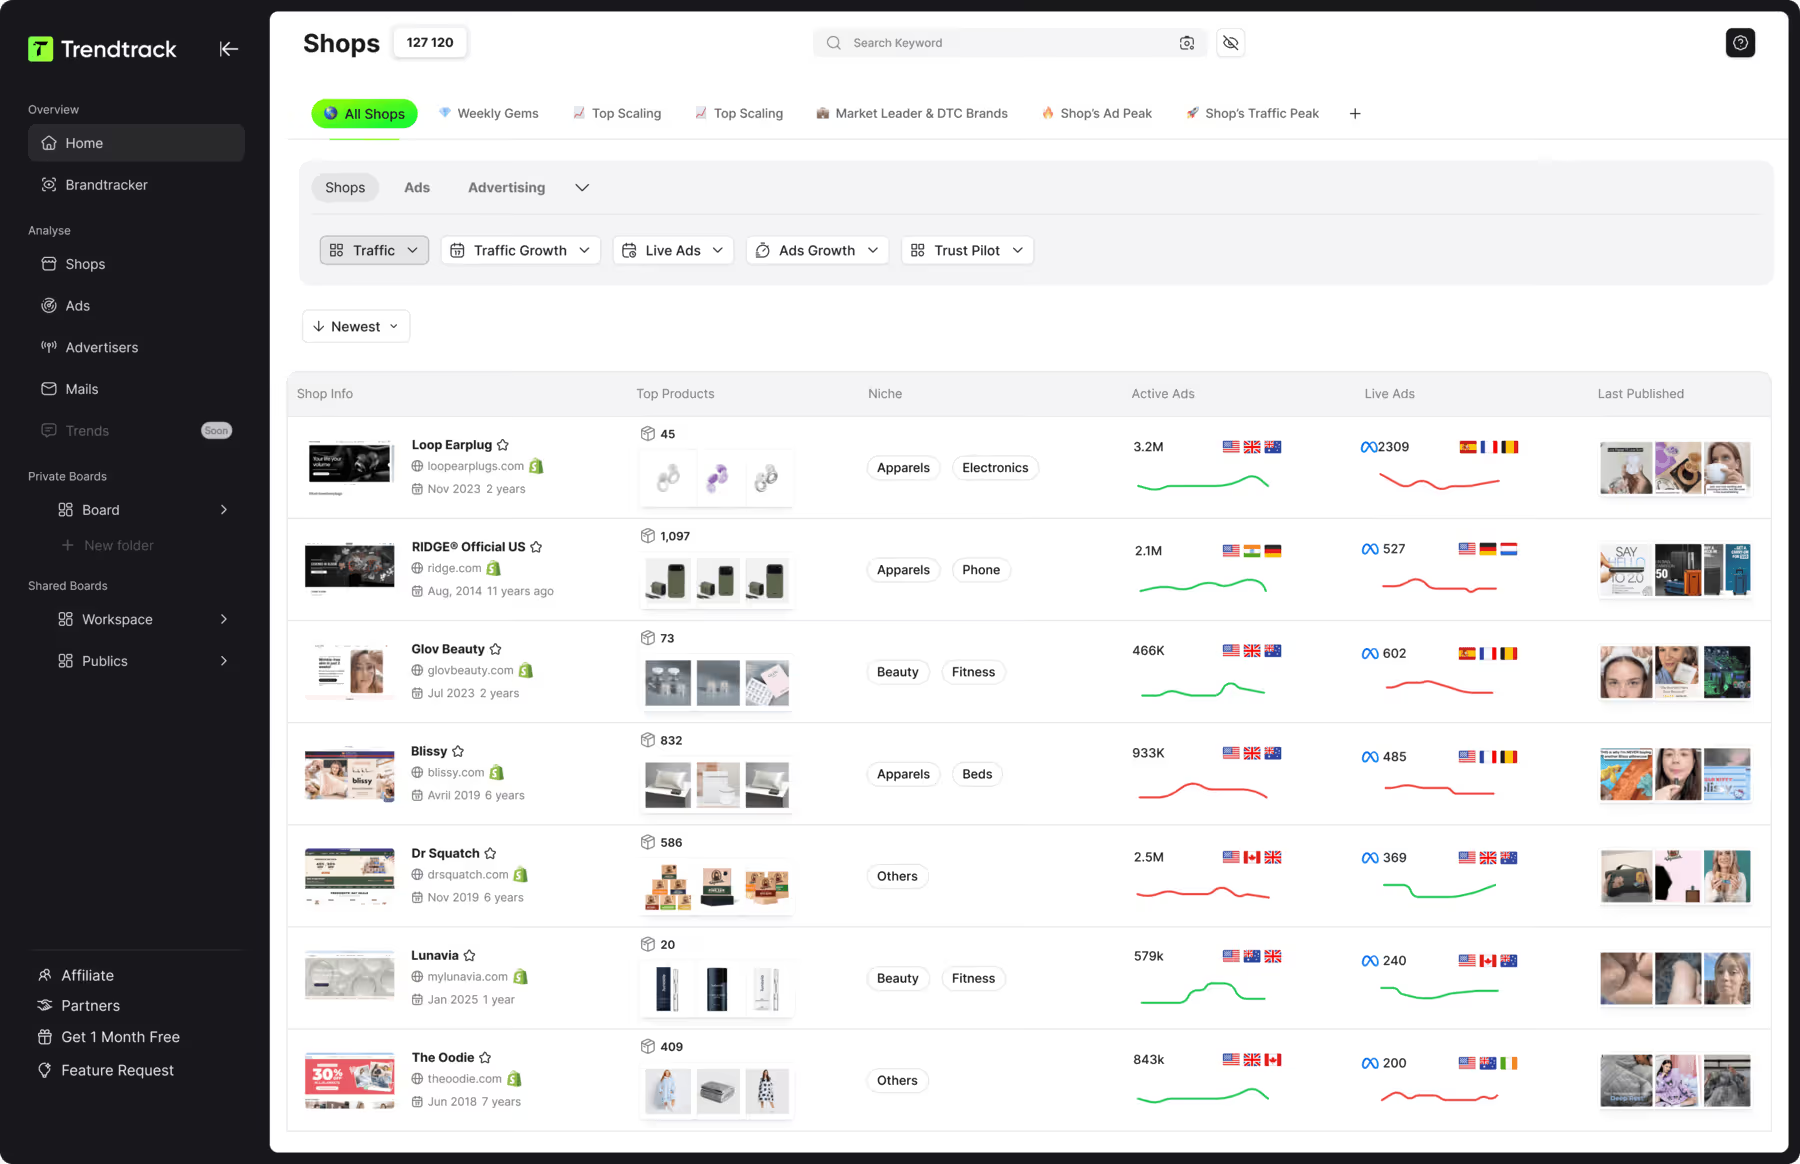
Where spy tools add value third-party tools like Minea, BigSpy, or Pipiads offer additional filtering capabilities, estimated spend data, landing page capture, cross-platform comparison, and more granular performance metrics than the native library provides. For advertisers conducting deep competitive intelligence at scale, third-party tools complement rather than replace the native library.
Practical Applications for Advertisers
Hook research the opening two to three seconds of a TikTok ad determine whether the viewer stops scrolling or continues. Analyzing the hooks of long-running competitor ads reveals which opening formats a bold statement, a question, a visual surprise, a relatable scenario are stopping the scroll in a specific category.
Offer benchmarking: understanding what discount depths, bundle structures, free shipping thresholds, and guarantee lengths competitors are using in their ad creative helps calibrate offer competitiveness without requiring access to their sales data.
Format inspiration: identifying whether a category is dominated by UGC-style testimonials, polished brand videos, demonstration-focused content, or creator partnerships helps inform the creative direction that is most likely to resonate with a shared audience.
Whitespace identification: if every competitor in a category is running the same style of ad with the same messaging angle, that uniformity creates an opportunity. A brand that shows up with a meaningfully different creative format or value proposition stands out in a feed where everything else looks the same.
Key Limitations
No spend data. The TikTok Ads Library does not reveal how much an advertiser is spending only that an ad is or was active. Engagement metrics provide a proxy for performance but cannot substitute for actual spend and revenue data.
Limited historical depth. The library does not maintain an indefinite archive of all historical TikTok ads. Older campaigns may no longer be accessible, limiting the ability to conduct long-term trend analysis.
No targeting visibility. The library shows what ads are running but not who they are targeted at audience parameters, geographic targeting depth, and bidding strategy are not visible.
Creative without context. Seeing a competitor's ad creative without knowing the landing page, the offer details, or the post-click experience provides an incomplete picture of what is actually driving their results.

.avif)
Ready to build a million-dollar brand?
.avif)