How to Find Trending Products for Black Friday?



Black Friday rewards preparation, not reaction. By the time a product is visibly trending in late November, acquisition costs have already climbed and the margin that made it worth selling has gone. So how do you find trending products for Black Friday before everyone else does?
The timing question comes first. Products that perform on Black Friday are typically validated in September and October, scaled through early November, then pushed hard during the week itself. Starting your research in November means competing on a crowded auction with an unvalidated product.
Four signals separate a genuine opportunity from noise.
Ad longevity matters most. An ad running for three months is profitable, since nobody funds a losing campaign that long. An ad launched last week tells you nothing yet, and most tools cannot tell the two apart.
Scaling velocity comes next. A brand increasing its ad count from 40 to 300 within weeks has found something working, and that acceleration is visible before the product saturates.
Seasonal fit determines whether a product converts under gift-buying intent. Comfort, wellness and home categories consistently outperform in Q4, while impulse items with poor perceived value struggle.
Cross-platform presence finally. A product running simultaneously on Meta, TikTok and Google Shopping signals a serious operator rather than a one-channel test.
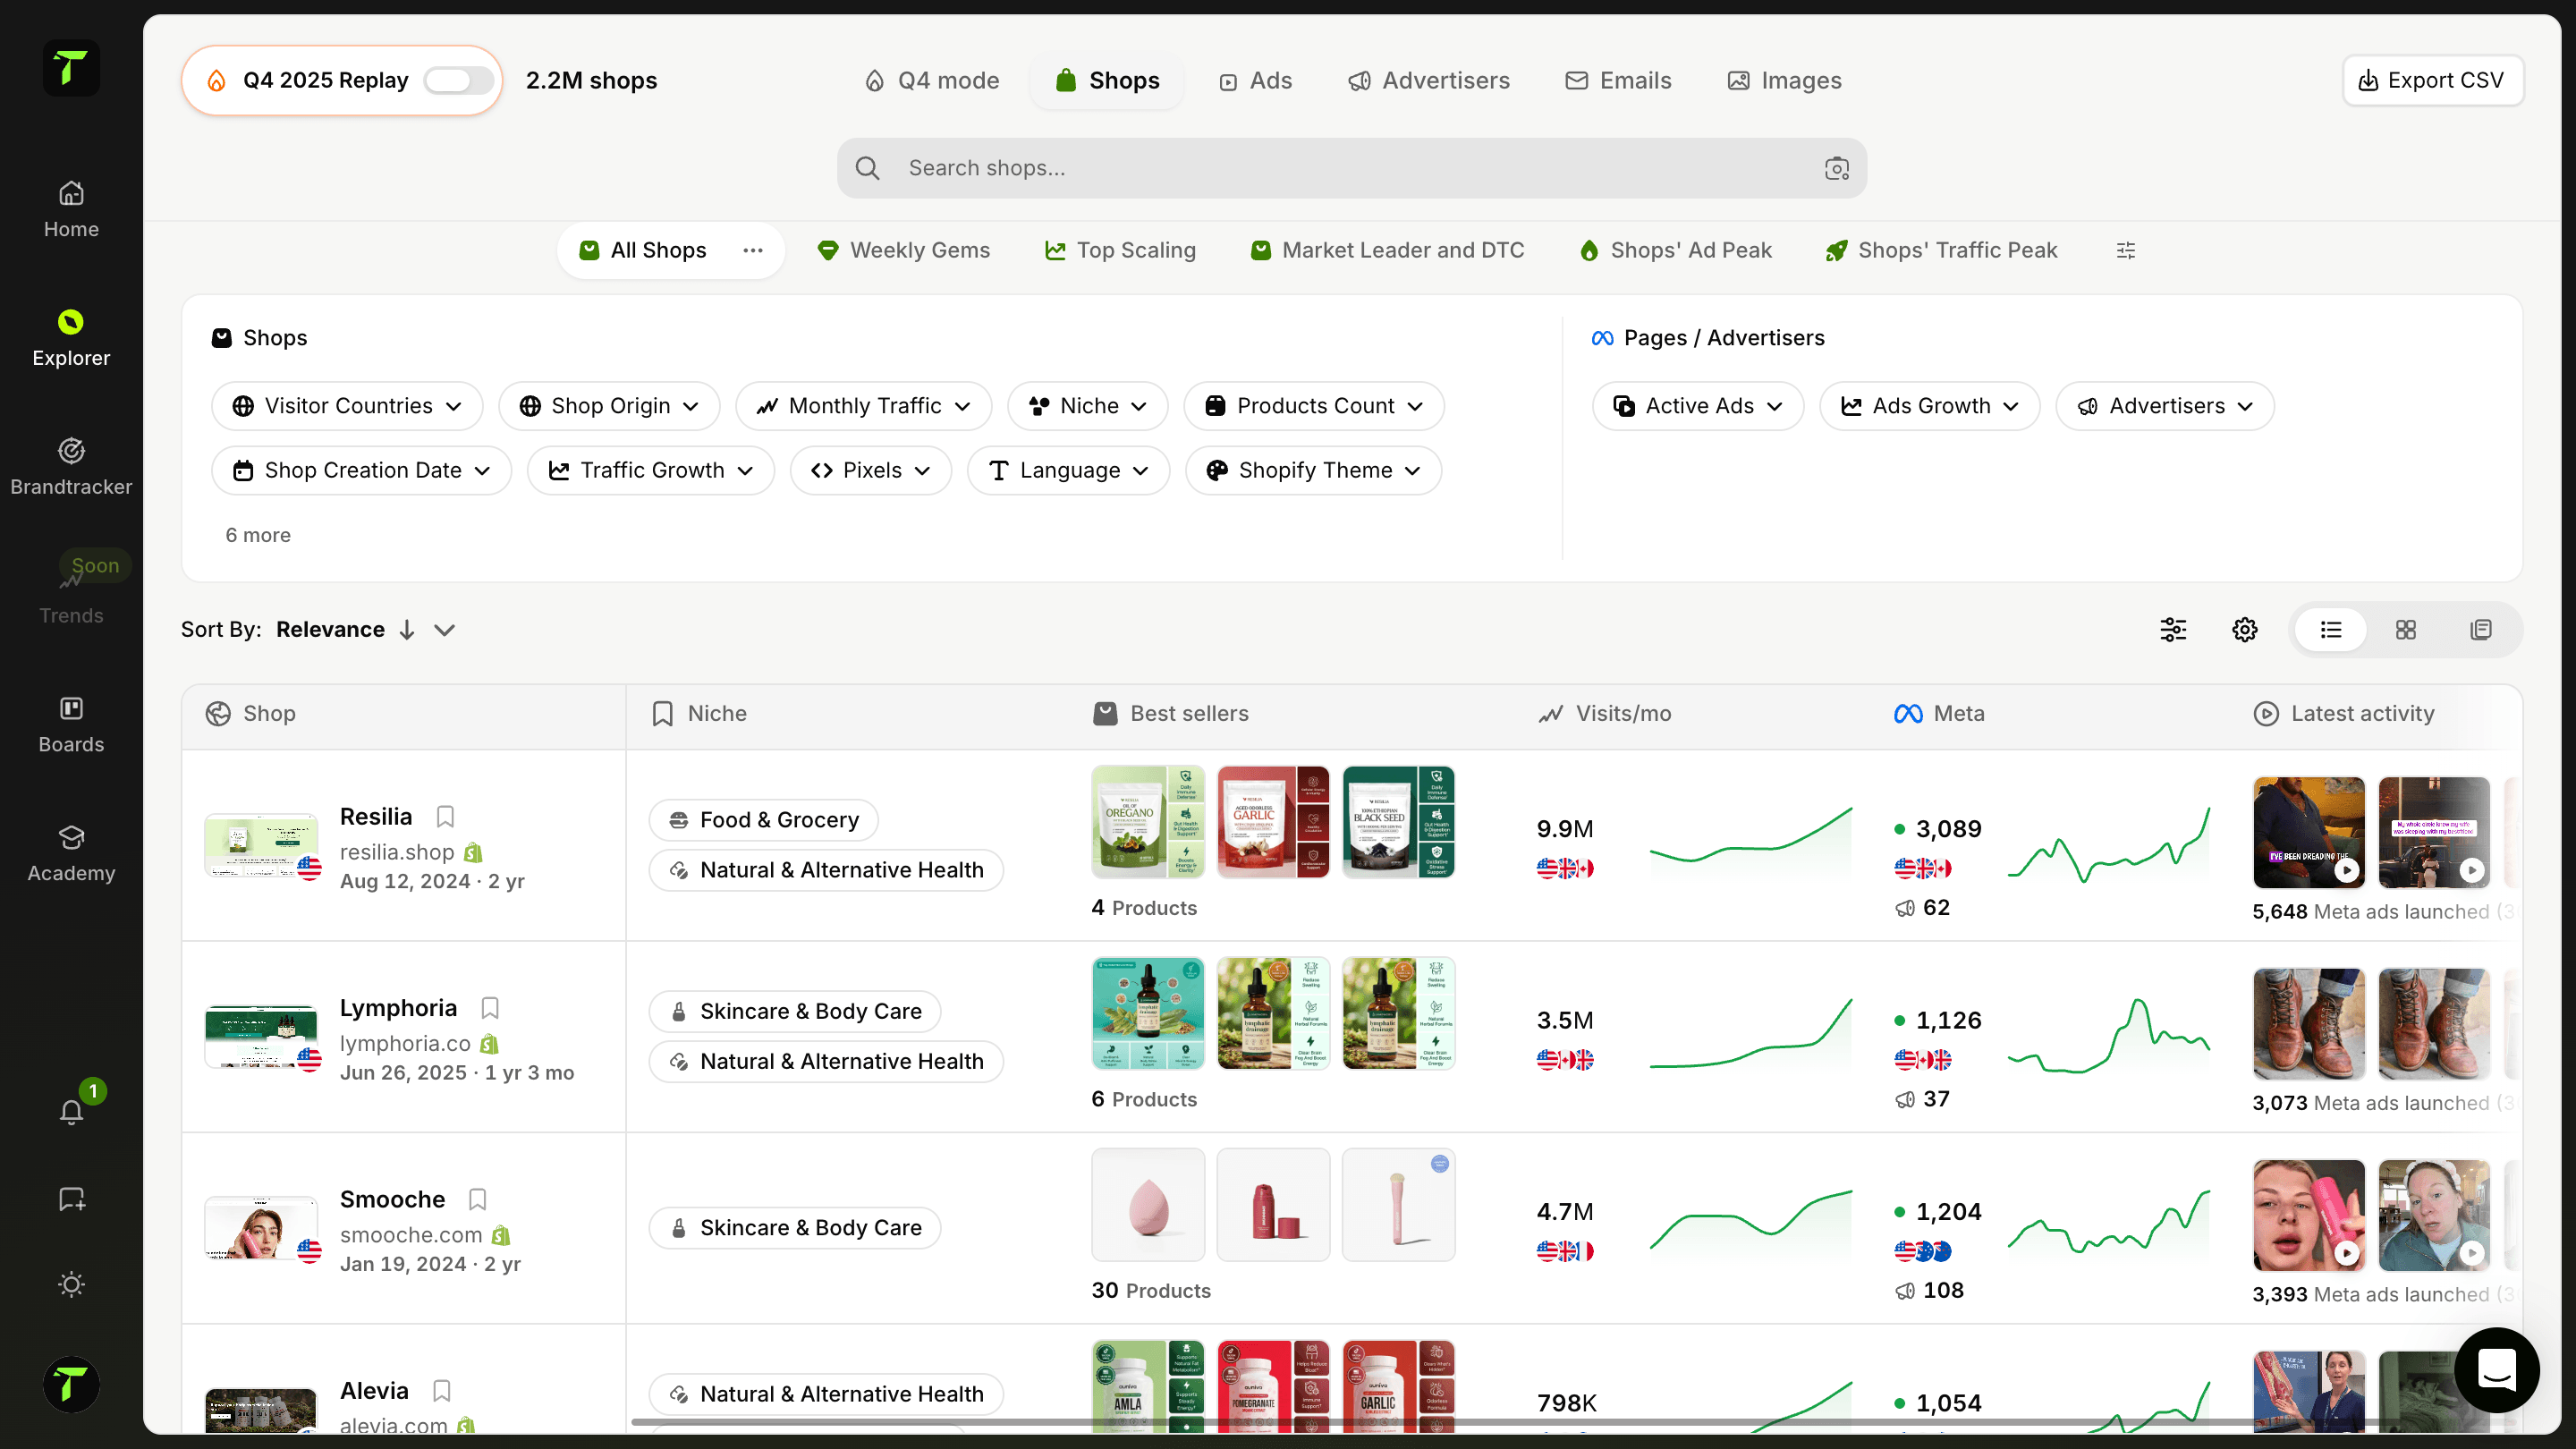
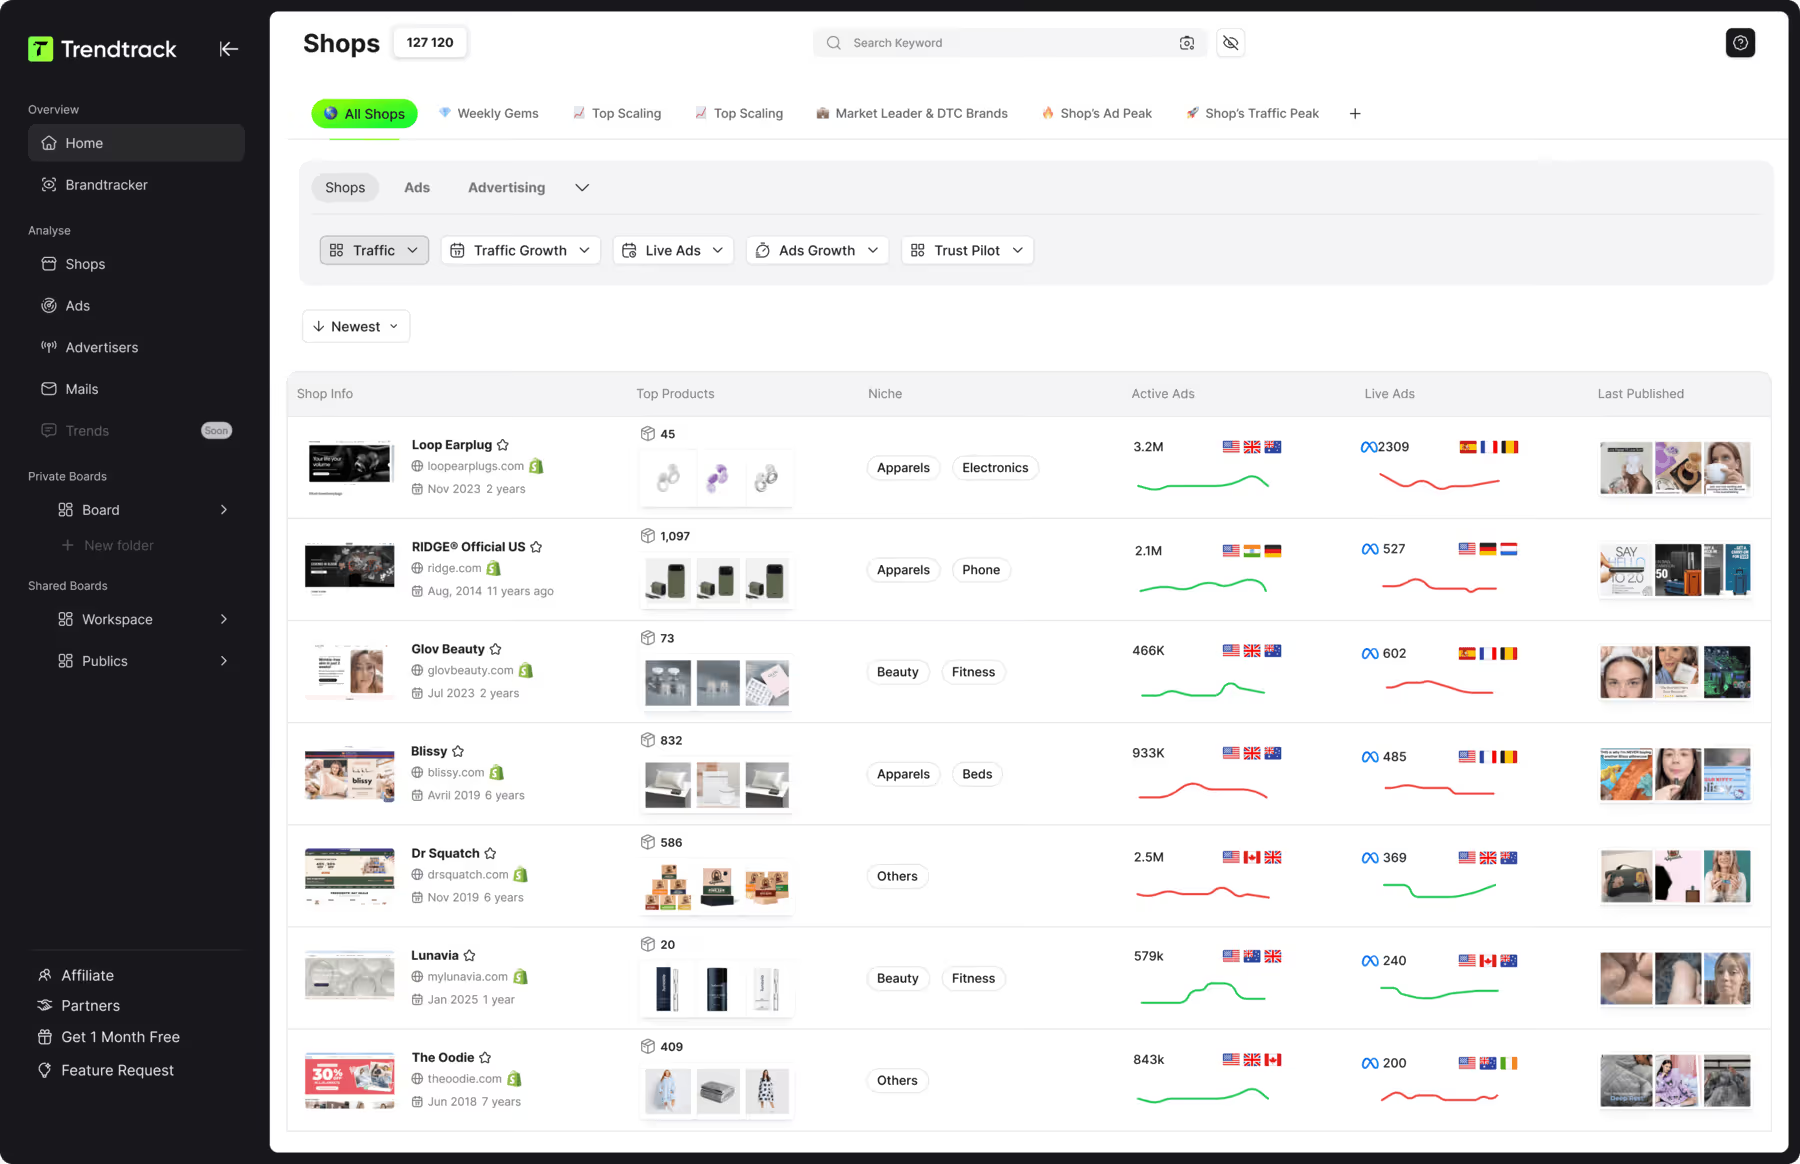
Trendtrack available at app.trendtrack.io/en/sign-up preserves full ad history across Meta, TikTok and Google, indexes 95 million TikToks and refreshes 700,000+ brand profiles every 24 hours, with BrandTracker monitoring competitors continuously.
In this article we explain how to find trending products before Black Friday.
When Should You Start Your Black Friday Product Research?
The honest answer surprises most sellers: three to four months ahead. Here is the timeline that works.
Table: Black Friday preparation timeline
| Period | What you do | Why it matters |
|---|---|---|
| August to September | Research and shortlist products | Finding candidates before competitors |
| Late September | Order samples, test suppliers | Verifying quality and lead times |
| October | Run small-budget ad tests | Validating conversion before scaling |
| Early November | Scale winners, build stock | Securing inventory before shipping delays |
| Mid-November | Prepare creatives and offers | Launching ready rather than improvising |
| Black Friday week | Execute and monitor | Capturing demand at peak |
As the table shows, the research phase sits well before the selling season. That gap is not caution, it is arithmetic.
Supplier lead times drive most of it. Ordering stock in November means competing with every other seller for production slots and shipping capacity, with Chinese New Year preparations compressing capacity further. Products ordered late arrive after the window closes.
Ad testing takes longer than people allow. A genuine validation needs enough conversion data to exit the learning phase, which means seven to fourteen days per product at minimum. Testing three candidates sequentially consumes a month before you have an answer.
Creative production adds another constraint. The ads that perform on Black Friday are rarely the first version. You need iteration cycles, and those require time your competitors will not have if they started in November.
One point deserves stating plainly. If you are reading this in mid-October, you have not missed the window, but your approach must change. Skip the sample-ordering phase, work with suppliers you already trust, and focus your research on products already proven by other sellers rather than hunting for something undiscovered.
That shift matters. Finding a product nobody is running requires months of testing. Finding a product running profitably for someone else takes an afternoon with the right data, and you enter a market already validated.
The risk is saturation, which is why ad longevity and scaling velocity matter more than raw popularity.
Trendtrack available at app.trendtrack.io/en/sign-up preserves full ad history so you can distinguish a product proven over months from one launched last week.
How Do You Identify a Trending Product With Trendtrack?

The method matters more than the volume of data you look at. Here is the sequence that works.
Filter by category and target market
Sort by ad longevity rather than popularity
Check the scaling curve
Verify cross-platform presence
Examine the landing page and offer
Assess saturation level
Track the brand continuously
The first step is to filter by category and market. Narrow to the categories that perform in Q4, then to the geography you actually sell into. A product dominating the US market may have no traction in France, and vice versa.
The second step is where most sellers go wrong. Sort by longevity, not by what looks popular. An ad running for three months is profitable, since nobody funds a losing campaign that long. An ad with high engagement launched last week is a test, not a validation.
Trendtrack preserves full ad history, which is precisely what makes this distinction possible. Tools showing only live ads cannot tell them apart.
The third step is to check the scaling curve. A brand moving from 40 active ads to 300 over six weeks has found something working, and that acceleration appears before saturation hits. BrandTracker surfaces this automatically rather than requiring manual checks.
The fourth step is to verify cross-platform presence. A product running simultaneously on Meta, TikTok and Google Shopping signals a serious operator with validated unit economics. A single-channel test signals someone still experimenting.
The fifth step is to examine the landing page. The creative gets the click, the page converts it. Study the offer structure, the proof elements and the pricing before assuming the product alone explains the performance.
The sixth step is to assess saturation. Count how many distinct advertisers run the same product. Three or four means opportunity. Forty means the auction is already expensive and your margin is gone before you start.
The seventh step is to track continuously rather than taking a snapshot. With 700,000+ brand profiles refreshed every 24 hours, you see launches, scaling and pullbacks within a day.
One practical note: watch what competitors stop running as closely as what they start. A product pulled after two weeks of heavy spend tells you something a trending list never will.
Get started at app.trendtrack.io/en/sign-up.
Which Product Categories Perform Best on Black Friday?
Not every category converts under gift-buying intent. Four consistently outperform, and the data currently running confirms it.
Comfort and loungewear
This is the strongest category heading into Q4, and the scale of activity makes that obvious.
Comfrt runs 7,279 active ads on its Affirmation Hoodie at 39 dollars, drawing 19 million monthly visits with traffic up 18% over thirty days. That ad volume is not a test, it is a brand that has validated its economics and is pushing hard into the season.
The category works because comfort products carry high perceived gift value at accessible price points. A hoodie or lounge set photographs well, needs no sizing precision as a gift, and converts on emotional rather than functional appeal.
Your entry point is not competing with Comfrt directly but finding the angle they have not covered.
Wellness and supplements
The second category performs on a different mechanism: new year intent arriving early. Buyers start planning January habits in late November, and Black Friday pricing lets them stock up.
Black Girl Vitamins runs 1,176 active ads on its collagen powder at 31.99 dollars, with 4 million monthly visits and 27% traffic growth. ClarityMD shows similar momentum with 142 ads on its astaxanthin supplement at 59.99 dollars, 3.2 million visits and 18% growth.
Both operate at price points above the impulse threshold, which tells you the category sustains margin rather than competing purely on discount.
One caution: supplements carry regulatory constraints on claims that vary by market. Verify your compliance before scaling ad spend.
Home textiles and cozy goods
The third category is the most accessible for smaller sellers, precisely because entry prices are low.
The Animal Rescue Site runs 41 active ads on a fleece throw blanket at 14.99 dollars, pulling 9 million monthly visits. The ad count is modest, which means the category is not saturated at that price point.
Low-ticket home goods work on Black Friday because they fit the secondary gift slot: the item people add to reach free shipping, or buy for someone they do not know well. Volume compensates for margin.
Fitness and recovery equipment
The fourth category sits at a higher price point and rewards sellers who can handle it.
MerachFit runs 190 active ads on a vibration plate at 119.99 dollars, with 3 million monthly visits. Higher ticket means fewer units needed to hit revenue targets, and Black Friday discounting is particularly effective above 100 dollars because the saving feels substantial.
The constraint is shipping and returns. Equipment is heavy, which compresses margin on logistics and makes return handling expensive. Factor both before committing.
What these four have in common
Each solves a gift-buying problem rather than a purely functional one. Comfort products feel personal. Supplements signal care. Home textiles are safe choices. Equipment delivers perceived value at a discount.
Note that all figures above reflect activity at the time of writing. Ad counts and traffic shift weekly in Q4, which is why continuous tracking matters more than a snapshot.
Trendtrack available at app.trendtrack.io/en/sign-up refreshes 700,000+ brand profiles every 24 hours.
What Mistakes Should You Avoid in Your Black Friday Research?

Several errors cost sellers their margin before the season even starts.
Starting research in November, when supplier lead times have already closed
Chasing popularity instead of longevity, which confuses tests with validated products
Ignoring saturation levels on products already run by forty advertisers
Copying the product without the offer, missing what actually converts
Underestimating shipping timelines, particularly from Chinese suppliers in Q4
Testing creatives during Black Friday week rather than before
Discounting without calculating your real margin after rising ad costs
Relying on trending lists every subscriber receives simultaneously
Judging a product on a snapshot rather than on its scaling curve
Among these, chasing popularity instead of longevity is the most expensive. A product with high engagement launched last week tells you nothing, while an ad running for three months is profitable because nobody funds a losing campaign that long. Most tools cannot distinguish the two, which is precisely why preserved ad history matters.
Ignoring saturation comes a close second and compounds the first error. Finding a validated product is only half the work. If forty advertisers already run it, the auction is expensive and your margin disappears before your first sale. Count distinct advertisers before committing.
Copying the product without the offer catches sellers who look only at creatives. The ad earns the click, the landing page converts it. Study the offer structure, the proof elements and the pricing, because a competitor outperforming you on the same product usually does so on the page rather than the ad.
Discounting without calculating deserves particular attention in November. Acquisition costs climb sharply as every advertiser bids simultaneously, which means a 30% discount that worked in September can run at a loss in Black Friday week. Recalculate your margin against current CPMs, not last quarter’s.
One final point: ad costs rise before the discount period. Build that into your projections rather than discovering it mid-campaign.
FAQ: Your Questions About Black Friday Product Research
When exactly is Black Friday in 2026?
Black Friday falls on November 27, 2026, the day after Thanksgiving. Cyber Monday follows on November 30. In practice the selling window has expanded well beyond those two dates, with most brands running offers from mid-November through the first week of December. That extension matters for your planning: the competitive pressure on ad costs starts building in early November rather than on the day itself, which is why your products need to be validated and your stock secured before that ramp begins.
Is it too late to start if I begin in October?
No, but your approach has to change. Skip sample ordering and work with suppliers you already trust, since lead times from new partners will not fit the window. More importantly, shift your research from hunting undiscovered products to identifying what already runs profitably for other sellers. Finding something nobody sells requires months of testing. Finding a product with three months of sustained ad activity takes an afternoon with the right data, and you enter a market already validated by someone else’s budget.
How do I know if a product is already too saturated?
Count the distinct advertisers running it, not the total ad volume. Three or four advertisers signals opportunity. Forty means the auction is expensive and your margin disappears before your first sale. Check the trend as well: a product gaining advertisers weekly is heading toward saturation, while one holding steady at a modest count may have room. Trendtrack surfaces advertiser counts directly, which turns this from a guess into a verifiable number.
Should I discount more aggressively during Black Friday week?
Only after recalculating your margin against current acquisition costs. CPMs climb sharply in November as every advertiser bids simultaneously, which means a 30% discount that was profitable in September can run at a loss during Black Friday week. Run the arithmetic with realistic CPMs rather than your historical average. Many sellers discover afterward that their highest-revenue week was also their least profitable.
How many products should I test before Black Friday?
Three to five candidates is realistic for most operations. Each genuine test needs seven to fourteen days to exit the learning phase and produce usable conversion data, which means testing sequentially consumes a month or more. Testing too many spreads your budget thin and produces inconclusive results across all of them. Better to validate two products properly than to half-test six.
Do trending product lists work for Black Friday?
Rarely, and the reason is structural. A curated list reaches every subscriber simultaneously, which means hundreds of sellers launch the same product within days. By the time you have built your store and ordered stock, the auction is crowded and your acquisition costs reflect it. Use such lists for inspiration rather than selection, then verify independently through ad longevity and advertiser counts before committing budget.

.avif)
Ready to build a million-dollar brand?
.avif)