What's a good ROAS for Facebook Ads: 2026 benchmarks


ROAS (Return on Ad Spend) measures how much revenue you earn for every dollar spent on advertising.
For years, the "4:1" ratio dominated digital ads. Spend $1, get $4 back. This simple target worked in an earlier era. But in 2025, it limits growth. Markets matured, privacy barriers increased, and the old math no longer reflects reality.
{{cta-1}}
3 main takeaways
- Forget the 4:1 rule. The average ROAS across industries is around 2.19:1, and iOS attribution loss means your real returns are likely 20–30% higher than what Ads Manager shows.
- Calculate your break-even ROAS first. Use the formula: BEROAS = 1 ÷ Profit Margin. This is your true benchmark—not industry averages or competitor claims.
- Match ROAS targets to your business model. Low-margin ecommerce needs 4:1+, high-margin brands can profit at 2:1, and subscription businesses should optimize for lifetime value, not Day 1 returns.
The origin of the 4:1 target and why it is outdated

The 4:1 ratio became popular because it covered costs like COGS, shipping, and agency fees while maintaining profit. Today, this one-size-fits-all rule ignores real differences between businesses and industries.
The current average ads ROAS across industries is around 2.19. However, it can vary a lot.
Comparing these numbers directly is pointless. The idea of a "universal good ROAS" is a myth. Pausing campaigns just because they don't hit 4.0 risks cutting off your best performers. Validate your results with data instead of guessing. This helps you stay ahead of competitors with less effort.
How iOS updates and attribution loss skewed the numbers

Privacy changes and iOS updates disrupted the clear click-to-sale tracking. Mobile-heavy businesses often experience about 20–30% attribution loss.
Many purchases originally driven by ads appear in analytics as Direct or Organic traffic. This happens because users return later, or the platform's 7-day click window misses their journey.
A campaign showing 2.2 ROAS in Ads Manager might actually generate 2.8 to 3.0 in real revenue. Multi-touch attribution often reveals platform-reported ROAS is 20–40% lower than the real number.
Don't reduce budgets based only on Ads Manager numbers. Always cross-check total store revenue and multi-touch attribution data. Launch campaigns with confidence by relying on accurate, comprehensive metrics. Stop wasting time on less reliable data.
2025 data: what is a good ROAS for Facebook ads really?
A good ROAS average combines everything from low-AOV impulse buys to long sales cycles, which flattens large differences into a single number. Treat it as a quick reality check but avoid making it your primary KPI. Validate ideas with data.
This figure tracks revenue across hundreds of ecommerce verticals and often understates real returns. Post-iOS attribution loss pushes many purchases into Direct or Organic buckets.
Depending on your setup, the actual economic impact can be about 20–30% higher than what Ads Manager shows. Launch your campaigns confidently with real data.
The average ROAS is 2.19 across all industries
The global average treats all revenue equally, regardless of margin, shipping costs, or AOV. Here are some examples:
- Ecommerce stores with varied margins typically see ROAS around 2.00.
- Finance & Insurance brands with high lifetime values commonly see ROAS around 3.50 because each conversion brings significant long-term value.
- Post-iOS tracking causes dashboard numbers to be 20–30% lower than actual returns.
Do not base your spending solely on dashboard numbers. Validate with total store revenue and multi-touch attribution. Focus on the right metrics to stay ahead of your competitors.
Industry-specific benchmarks
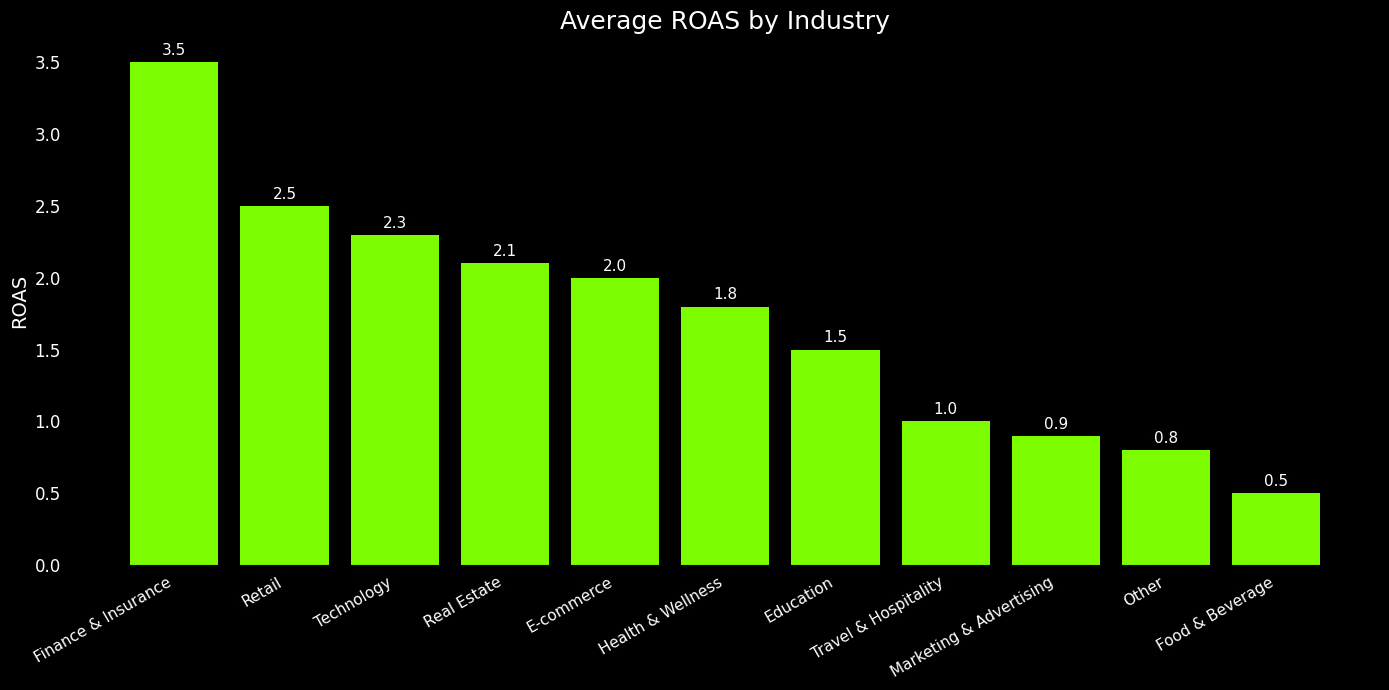
Benchmarks vary significantly by vertical. Here are realistic ROAS figures:
These benchmarks are guidelines, not strict rules. Use them to set realistic expectations for your vertical and audience.
How funnel stages and audience warmth impact expected returns
Funnel stage affects ROAS much more than the industry average. Avoid expecting cold traffic to perform like remarketing audiences.
- Cold Prospecting (1:1 to 3:1): Here, you pay for discovery. A 1.0 to 3.0 ROAS is typical. Cutting prospecting risks starving your funnel.
- Warm & Hot Retargeting (4:1 to 10:1): Cart abandoners and recent engagers should return 5:1 to 10:1. Warm audiences generally perform between 3:1 and 6:1.
Allocate 40–50% to cold prospecting and 20–30% to hot remarketing to capture intent and maintain funnel health.
Timing differences between B2B and B2C matter. B2C tests move quickly, while B2B and high-ticket offers take longer. A SaaS campaign with a 1.5:1 ROAS on day one can grow to 5:1 over years. Avoid killing campaigns before they prove their lifetime value.
Focus on the right benchmarks for your product, funnel stage, and economics. Measure, validate, and scale steadily.
Benchmark vs. Break-Even ROAS
Marketers often chase headline ROAS like a high score. However, a 5x return can look good on a dashboard yet still drain your business financially.
The real indicator is your Break-Even ROAS (BEROAS), which shows the exact point where your revenue covers all costs. If you are above it, you scale profitably. Below it, you lose money no matter how impressive the ROAS seems.
Defining reported ROAS versus break-even ROAS
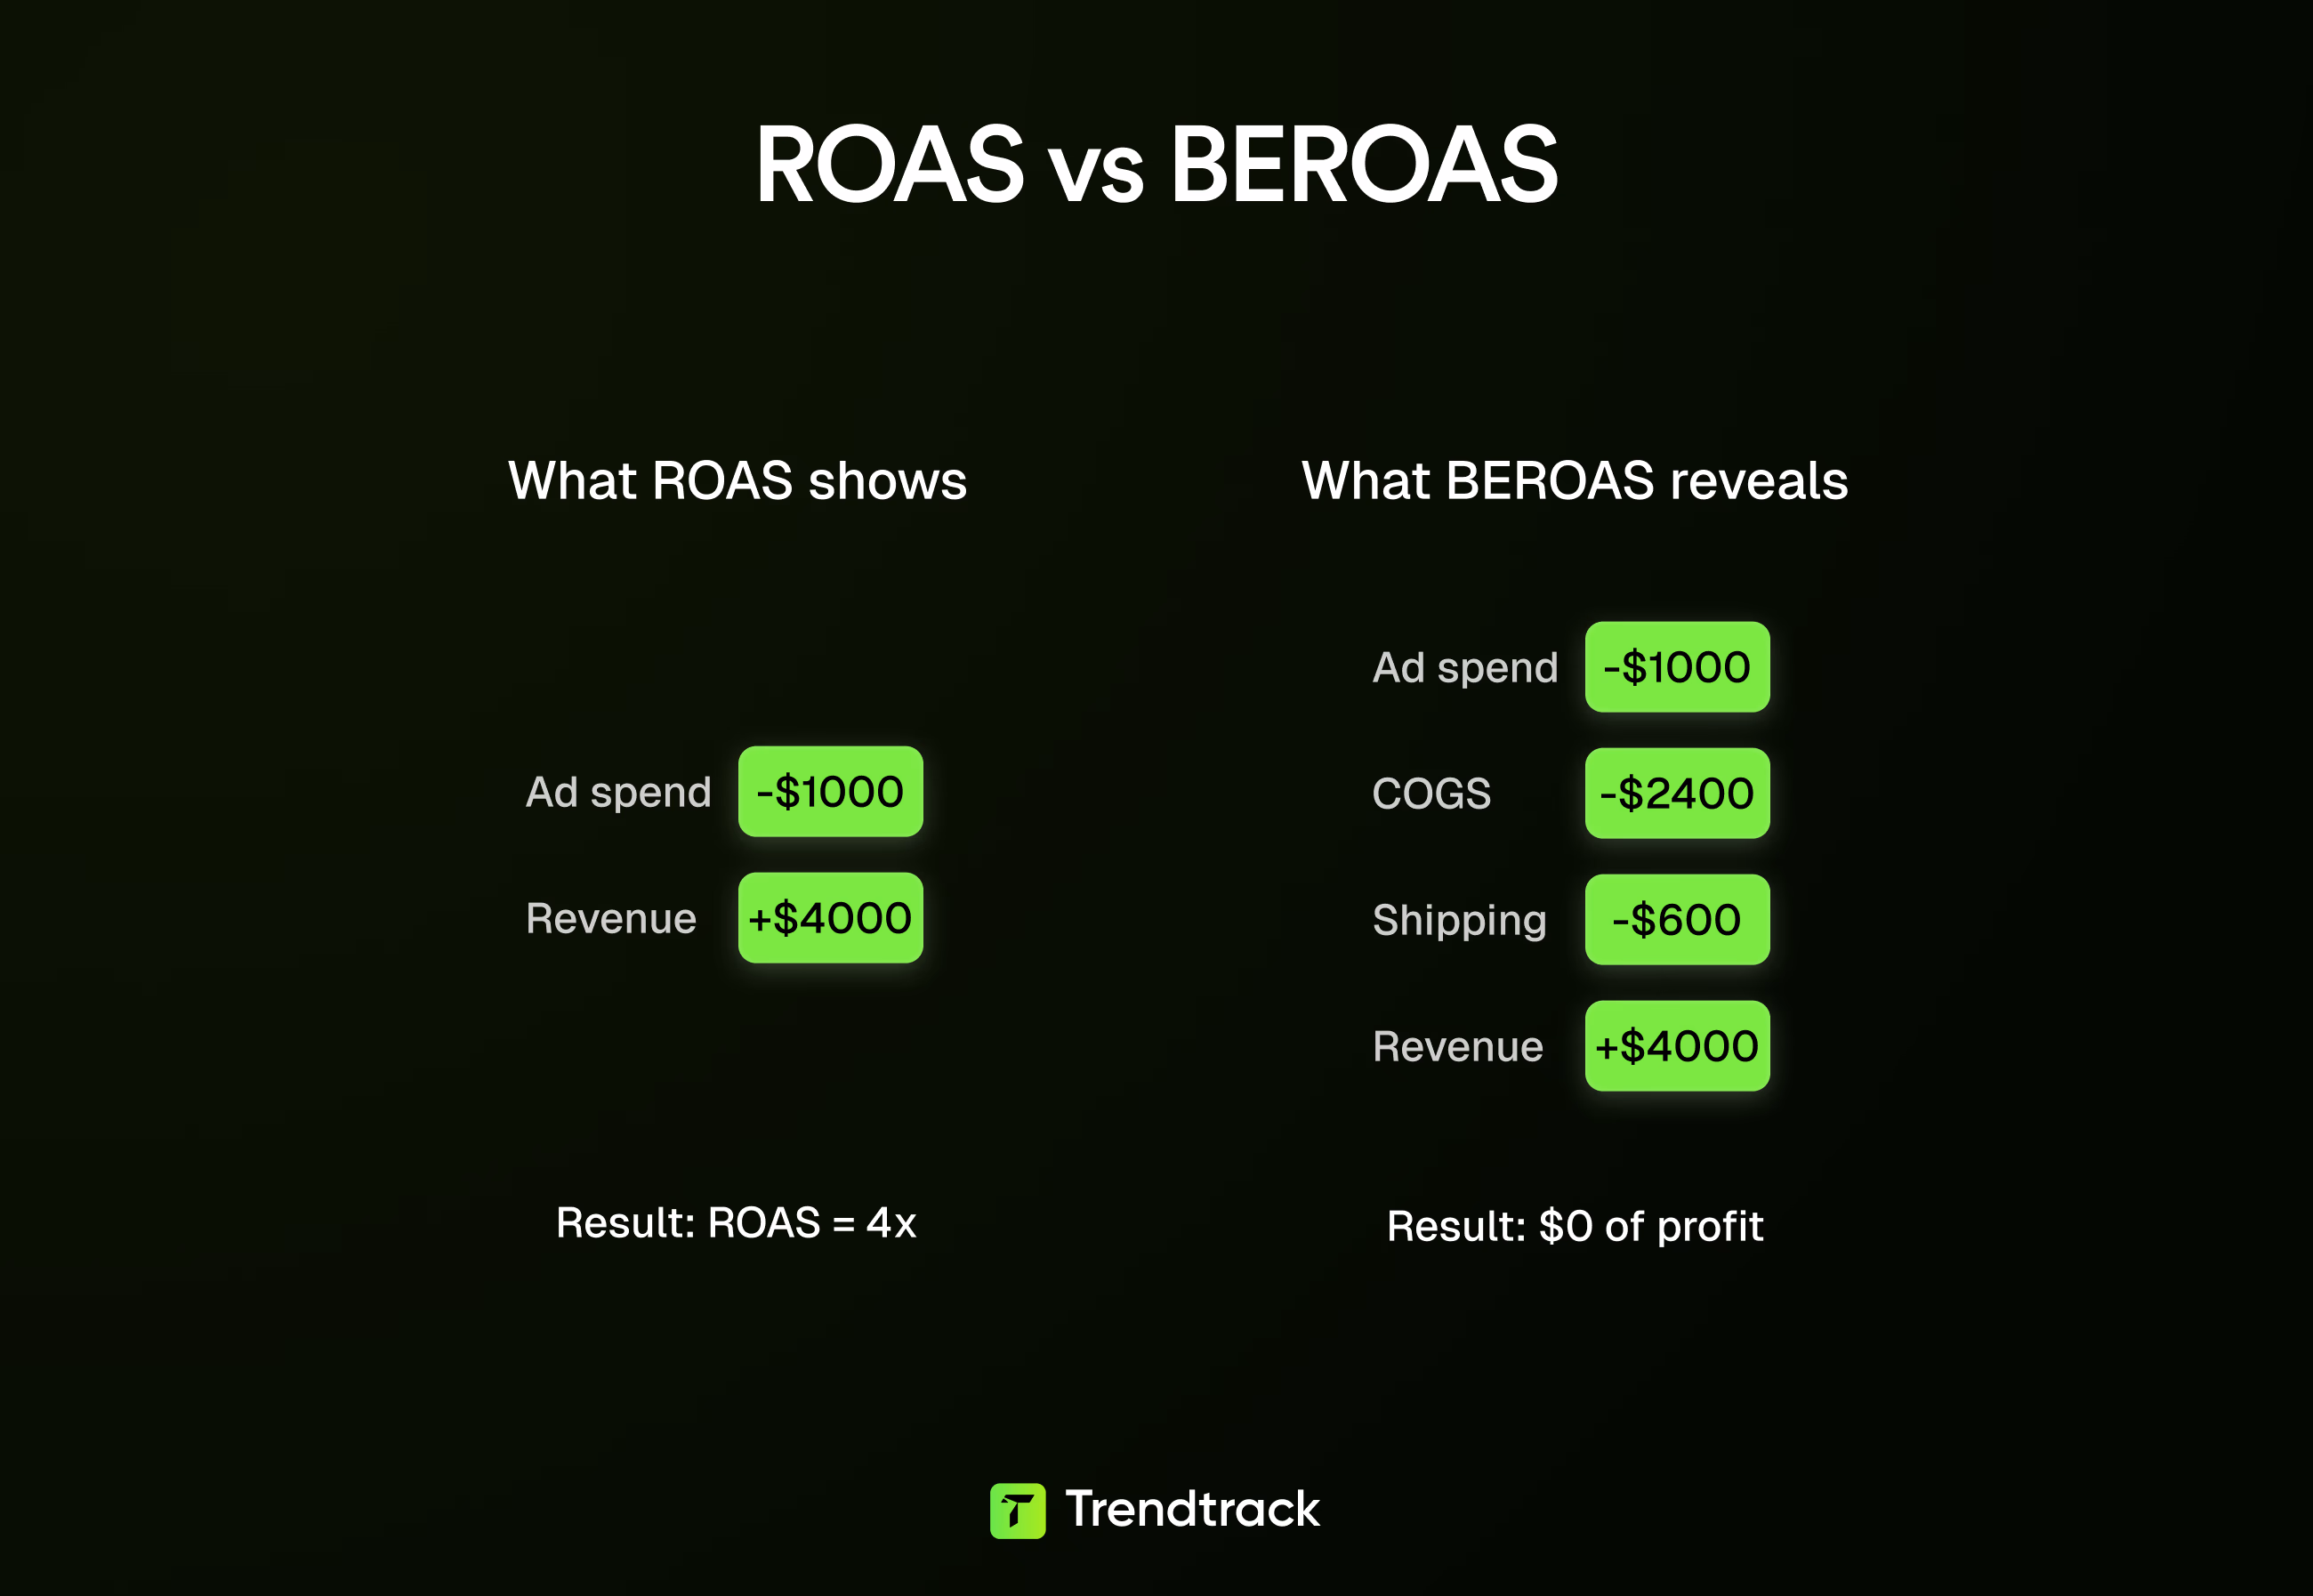
Reported ROAS equals revenue tracked divided by ad spend. It is useful but incomplete because it ignores costs that affect actual profit, such as:
- COGS
- Shipping
- Transaction fees
- Other variable expenses
Break-Even ROAS acts as your survival line or guardrail. For example, a clothing brand with a 4.0 ROAS might still need 5.0 to break even.
In contrast, a supplement brand with high margins can profit at around 1.7 ROAS. Avoid optimizing for vanity metrics. Focus on the threshold that keeps your business sustainable.
Validate your ideas with real numbers, not guesses.
How to calculate break-even ROAS using your margins
The formula is straightforward:
Break-even ROAS = 1 ÷ Profit margin
For example, if your profit margin is 25%, the calculation is 1 divided by 0.25, resulting in 4. This means you need $4 in revenue for every $1 spent on ads just to break even.
Make sure your margin accounts for all variable costs that increase with each sale, including:
- Product acquisition or manufacturer price
- Variable fulfillment like pick-and-pack, inserts, and packaging
- Shipping and labels
- Platform and transaction fees such as Shopify and payment processors
- Duties and import fees (landed costs)
For example, a $40 order costing $16 in production, $4 in shipping, and $0.80 in payment fees leaves a $19.20 gross profit. This equals a 48% margin and a break-even ROAS of 1 ÷ 0.48 = 2.08. If you omit shipping or fees, you risk setting a dangerously low target and scaling unprofitable campaigns.
Want to understand how different business models impact profitability? Learn more about how to calculate break-even ROAS across various industries and cost structures.
Using the Trendtrack calculator to find your exact number
Trendtrack's Break-Even ROAS calculator eliminates manual calculation errors. You enter your selling price, COGS, shipping, and taxes to get your true baseline instantly.

This tool transforms decision-making. Compare a 2.4 ROAS campaign against a 2.1 ROAS campaign differently when your break-even sits at 2.35. The first campaign turns profitable. The second wastes your budget.
Launch campaigns with confidence backed by real data.
Why high margins allow for lower ROAS targets
Margin creates flexibility. High-margin brands can operate at lower ROAS while staying profitable. This advantage lets them outbid competitors and test new creative with less risk.
- A low-margin dropshipper with a 20% margin requires a BEROAS around 5.0, demanding extremely precise optimization.
- High-margin supplement and skincare brands with 60% margins break even near 1.67. They can scale aggressively with campaigns that would bankrupt dropshippers.
Copying competitors’ ROAS targets is risky because your costs determine your profitability, not generic benchmarks. Understand your true costs to get ahead without guessing.
When low ROAS is actually a winning strategy
Seeing a 1.2 ROAS often causes panic. Kill the campaign, fire the agency, rewrite creative. This knee-jerk reaction kills long-term growth. Low daily ROAS can be the cost of validating an idea and achieving much larger future profits.
High LTV and subscription models justify higher acquisition costs
First-purchase ROAS is misleading for subscription and consumable businesses. Instead, focus on cohort lifetime value (LTV) rather than day-one numbers.
For example, a coffee subscription:
- Immediate math shows $30 revenue divided by $25 ad cost equals a 1.2 ROAS, which looks like a loss on day one.
- The reality: the average customer stays 8 months, paying $30 per month. This results in $240 lifetime revenue and a lifetime ROAS of 9.6:1.
Subscriptions often start with low ROAS (0.8–1.5 in month one), break even by month three, and become very profitable later. If you only optimize for Day 1 ROAS, you will miss acquiring the customers who generate recurring revenue.
How B2B and high-ticket sales cycles distort daily data
High-ticket and B2B campaigns show results slowly. Leads convert into revenue over weeks or months, so early ROAS undervalues their true worth.
For example, a SaaS campaign:
- Spend $5,000 to get 100 leads at $50 each.
- Five leads convert, each paying $2,000 upfront.
- Immediate ROAS is $10,000 divided by $5,000, or 2:1.
- If customers stay for three years, the true ROAS rises to 6:1.
Real estate follows a similar pattern, with median immediate ROAS around 2.10. Evaluate these campaigns by lifetime value, not quick benchmarks. Launch them confidently with real data, and avoid killing your best long-term channels based on short-term results.
The role of hybrid and omnichannel attribution
Post-iOS tracking limits cause mobile-heavy businesses to lose about 20–30% of attribution data. This hides the real impact of top-of-funnel activities.
Different types of campaigns serve distinct roles:
- Awareness campaigns often show 0.8–2.0 ROAS but build future demand.
- Retargeting campaigns typically have 6.0–12.0 ROAS and convert the seeded audience.
Last-click attribution undervalues upper-funnel ads. For example, a user might see your Instagram ad, then search directly later and make a purchase. Facebook reports nothing from this, but the ad created the customer journey.
Before cutting a "low ROAS" campaign, pause it briefly and watch total store revenue. If revenue drops, that campaign was driving significant value.
Instead of reacting hastily, analyze cohort LTV, attribution overlap, and how each campaign feeds the funnel. This proactive approach helps you stay ahead of competitors.
ROAS Targets by Business Model
Stop treating the global ROAS like a universal goal. That average mixes $10 impulse buys with six-figure real estate deals. Focus on your unit economics. Margins, AOV, returns, and funnel conversion rates. Define your business profile first, then judge ROAS accordingly.
Targets for low-margin high-volume ecommerce
If you operate high-volume, thin-margin businesses like dropshipping or fast fashion, efficiency determines survival. With margins around 20–25%, you need a much higher ROAS to stay solvent.
For example:
- A 25% margin means a break-even ROAS of about 4.0.
- A 2.0 ROAS in this case results in losing money on every sale.
Aim for a ROAS between 4:1 and 5:1 to ensure profitability. Use tight targeting and creatives designed for immediate conversions. Long nurture plays are too costly in this model.
Your unit economics determine your ROAS targets. Not industry averages. Learn to calculate the right ROAS benchmark for ecommerce based on your margins and profitability goals.
Expectations for high-margin and premium products
Luxury and premium brands with 60-80% margins can accept lower ROAS targets and bid aggressively for high-value customers.
Luxury brands often average a ROAS of 3.70 or higher. High margins allow spending on:
- High-production creative
- Premium ad placements
- Longer nurture cycles
For instance, a 67% margin corresponds to a break-even ROAS of approximately 1.49. A 3:1 ROAS here is very profitable and allows room for scaling. Carefully invest in customer desire to maximize return.
Goals for subscription and consumable businesses
Subscription and repeat-consumption models often show low or negative ROAS initially. These business models prioritize long-term profits over upfront costs.
Expect:
- Initial cash flow dips, with month 1 ROAS between 0.8 and 1.5
- A campaign starting with 0.9 ROAS in month one can grow to 8.2 over 12 months with strong retention
Focus on acquiring customers at break-even or slightly below. Then optimize backend retention to increase lifetime value and compound profits.
Track cohort lifetime value instead of just immediate ROAS to make informed decisions. Launch confidently using real data, not guesses.
How to Set Your Real ROAS Target
The ideal ROAS for a VC-backed SaaS can bankrupt a bootstrapped dropshipper. Your unit economics are the only reliable guide.
Work backward from your actual costs and margins. If you don’t know your numbers to the cent, you’re gambling with the algorithm. Use this four-step framework to create a ROAS target that keeps your business profitable.
Step 1: map out all costs (COGS, shipping, fees, returns)
Many founders stop at the supplier invoice and overestimate margin. True margin includes every variable cost that grows with each sale. These costs include:
- Product acquisition cost (manufacture or wholesale price)
- Fulfillment and logistics expenses (pick-and-pack, shipping, duties)
- Packaging (boxes, inserts, protective materials)
- Platform and transaction fees (Shopify, payment processors)
- Variable overhead per order (customer service, return handling)
For example, a $30 t-shirt with an $8 production cost might seem to have a 73% margin. But after adding $4 shipping, $1.50 packaging, and $1 processing fees, margin falls to about 45%. Calculate your full costs to avoid scaling losing campaigns and validate ideas realistically.
Step 2: determine your minimum acceptable profit margin
Calculate your Break-Even ROAS (BEROAS) using this formula:
BEROAS = 1 ÷ Profit Margin
For example:
- Dropshipper: $40 price, $32.20 total cost → 19.5% margin → BEROAS ≈ 5.13. A 4.0 ROAS here loses money.
- Brand owner: $100 price, $33 cost → 67% margin → BEROAS ≈ 1.49. A 2.0 ROAS here generates strong profit.
Any ROAS below BEROAS means you’re paying to ship products, not grow profitably.
Step 3: estimate lifetime value (LTV) if retention exists
If you sell subscriptions or consumables, Day 1 ROAS can mislead you. Factor in customer lifetime value (LTV) before cutting acquisition budgets.
With retention data, you can:
- Track first-time buyer value versus repeat buyer value
- Set lower ROAS targets for prospecting and higher for retargeting or retention campaigns
- Use cohort windows (30, 90, or 365 days) to reveal true business economics
This approach lets you bid more aggressively than competitors scared of sub-3.0 ROAS returns, helping you capture market share.
Step 4: set up dashboards: from break-even to profit
Once you know your BEROAS, set staged ROAS targets:
- Testing phase: aim for about 1.5 to 2 times BEROAS to validate creatives and audiences
- Scaling phase: aim for 2 to 3 times BEROAS to maintain profitability as spend grows
Shift from focusing on ROAS to POAS (Profit on Ad Spend), calculated as:
POAS = Gross Profit ÷ Ad Spend
- 1.0 POAS means break-even
- 2.0 POAS means healthy growth
- 3.0+ POAS indicates aggressive scaling potential
Use tools like Trendtrack or your own analytics to monitor competitor scaling and sanity-check your targets. If a similar brand is growing, reverse-engineer their margins to estimate their ROAS. Launching with real data helps you outpace competitors confidently and profitably.
{{cta-2}}
Practical levers that move ROAS beyond clicks
Fixing a weak ROAS goes beyond fresh creatives or different bid types. To improve returns significantly, focus on levers that change your funnel’s economics.
These include closing data gaps, enhancing your offer structure, and validating ideas before scaling. Validate an idea with data, not guesswork.
Improving creative relevance to lower CPM
Platforms lower CPMs when ads and landing pages align closely. Make sure your ad promise matches exactly with the landing page. For example:
- If the ad offers “30% off,” display that discount prominently above the fold.
- If your ad highlights a time-saving benefit, feature that benefit in the headline.
Use authentic assets like real reviews, customer clips, and brief testimonial soundbites. Specific details convert better than generic claims. "Saved me 15 minutes daily" outperforms "Great product." Track these wins, then scale what converts.
Increasing AOV through bundles and upsells
The cost to acquire a $100 customer often equals that for a $30 customer. Raising average order value spreads fixed costs and boosts ROAS, even if ad efficiency stays the same.
To do this:
- Test bundled offers in prospecting campaigns, such as “Buy 2, get 20% off,” to increase initial order value.
- Use retargeting to suggest complementary products instead of only the viewed SKUs.
Use first-party data to identify your highest-value customers. Tailor your messaging and make higher-value offers the default choice. This relieves pressure on ads and creates space to scale. Prioritize higher-value offers to outpace competitors.
Implementing CAPI to fix tracking blind spots
Due to iOS privacy updates, many mobile-heavy brands experience 20–30% attribution loss. Relying solely on browser pixels can make profitable campaigns appear ineffective.
Use Conversions API (CAPI) alongside the pixel to tackle this:
- Send server-side events to Facebook to recover blocked signals.
- Confirm attribution gaps by comparing spikes in ad activity to store revenue.
- Use URL parameters to cross-check data across platforms.
Avoid pausing ads based on incomplete data. Launch with accurate and reliable tracking.
Using Trendtrack to analyze competitor ad strategies
Competitor ad intelligence reveals what ROAS targets actually work in your market. Trendtrack makes it easy to reverse-engineer their approach.
Step 1: Identify scaling patterns
Track competitor ads change over 30–90 days. A brand jumping from 20 to 80 active ads signals they've found profitable campaigns worth scaling. Flat or declining ad counts suggest they're struggling to find winners.

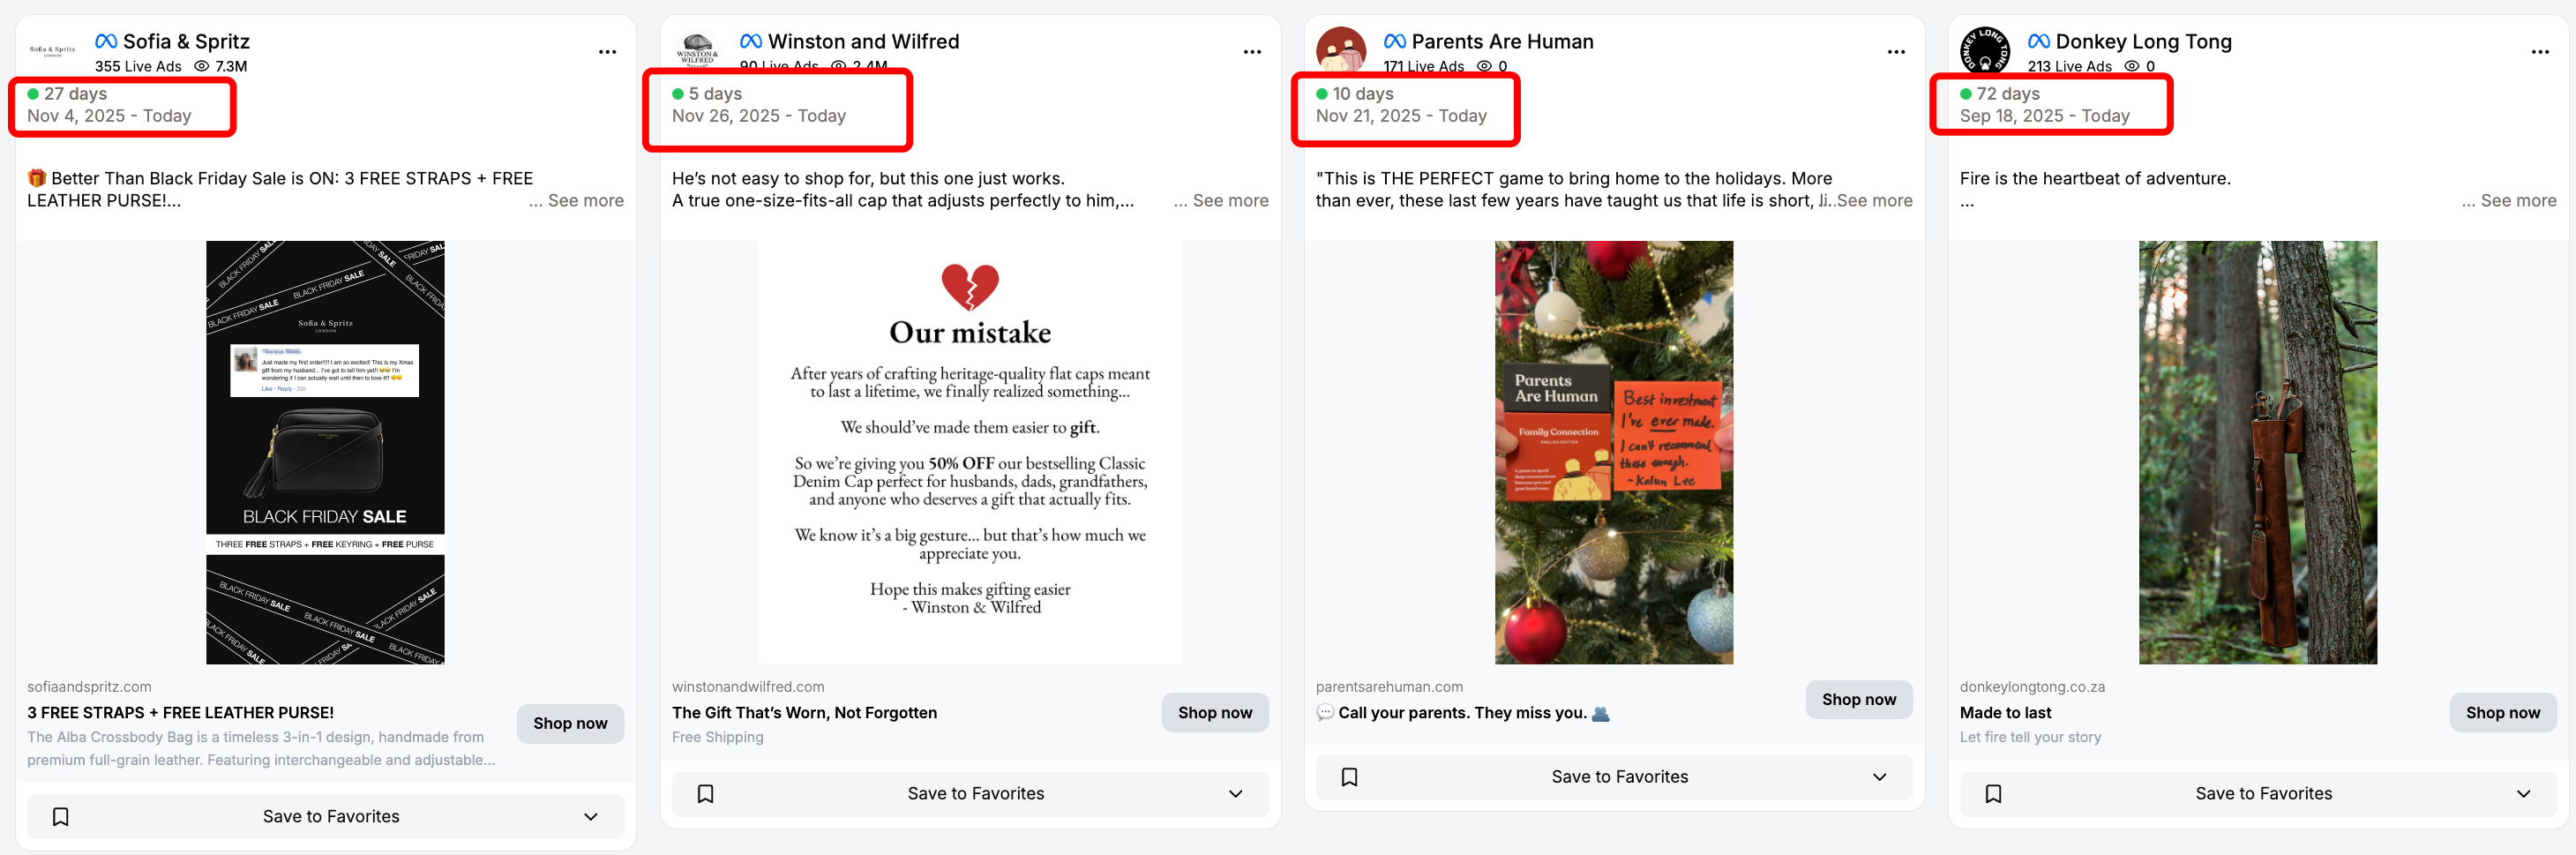
Step 2: Measure ad longevity
Note which ads stay active for months versus those that disappear in weeks. Long-running ads are usually cash cows generating consistent ROAS. Frequent creative rotation often indicates testing mode without a profitable baseline.
Step 3: Analyze messaging and positioning
Document the core messages, offers, and angles competitors emphasize. If three competitors all highlight free shipping or limited time, that angle likely resonates with your audience and justifies your own testing.

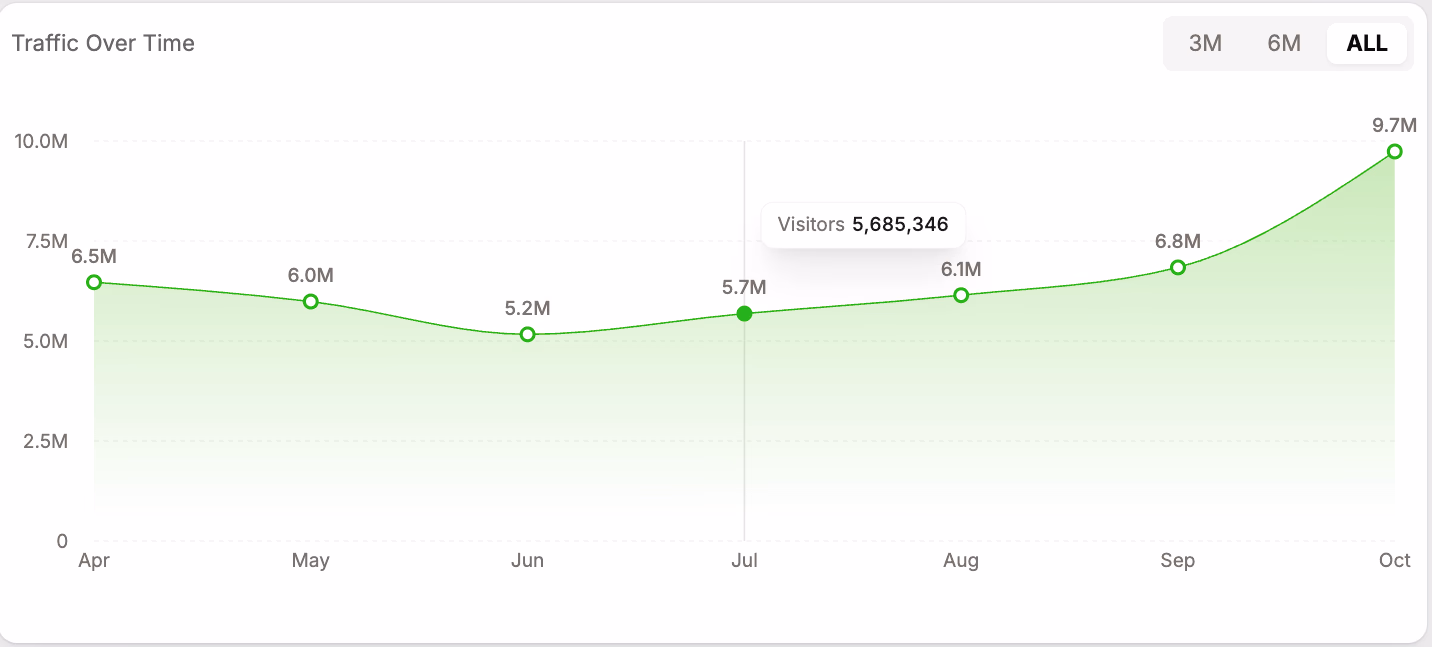
Step 4: Cross-reference with their traffic
Compare ad scaling with traffic growth. If a competitor adds 60 ads but traffic drops, something isn't working. If ad counts and traffic both rise, they're hitting sustainable ROAS and budgets are being pushed into winners.
Step 5: Benchmark your ROAS target
Use what you learn to adjust your own targets. If competitors scale profitably at 2.5 ROAS, your 4.0 target may be too conservative. Start testing at their level, then optimize from there.
{{cta-2}}
Conclusion: Your ROAS is Personal
A good Facebook ROAS isn't a universal number. It's determined by your margins, business model, and market. The 4:1 rule is outdated. The industry average is a starting point, not a target.
Your real benchmark is your break-even ROAS. Everything above it is profit. Calculate it precisely, benchmark it against competitors doing similar volume, and scale with confidence.
Stop chasing vanity metrics. Start chasing profitability. Use Trendtrack, validate with real data, and move faster than competitors who are still guessing.


.avif)
Ready to build a millions dollars brand ?
.avif)
