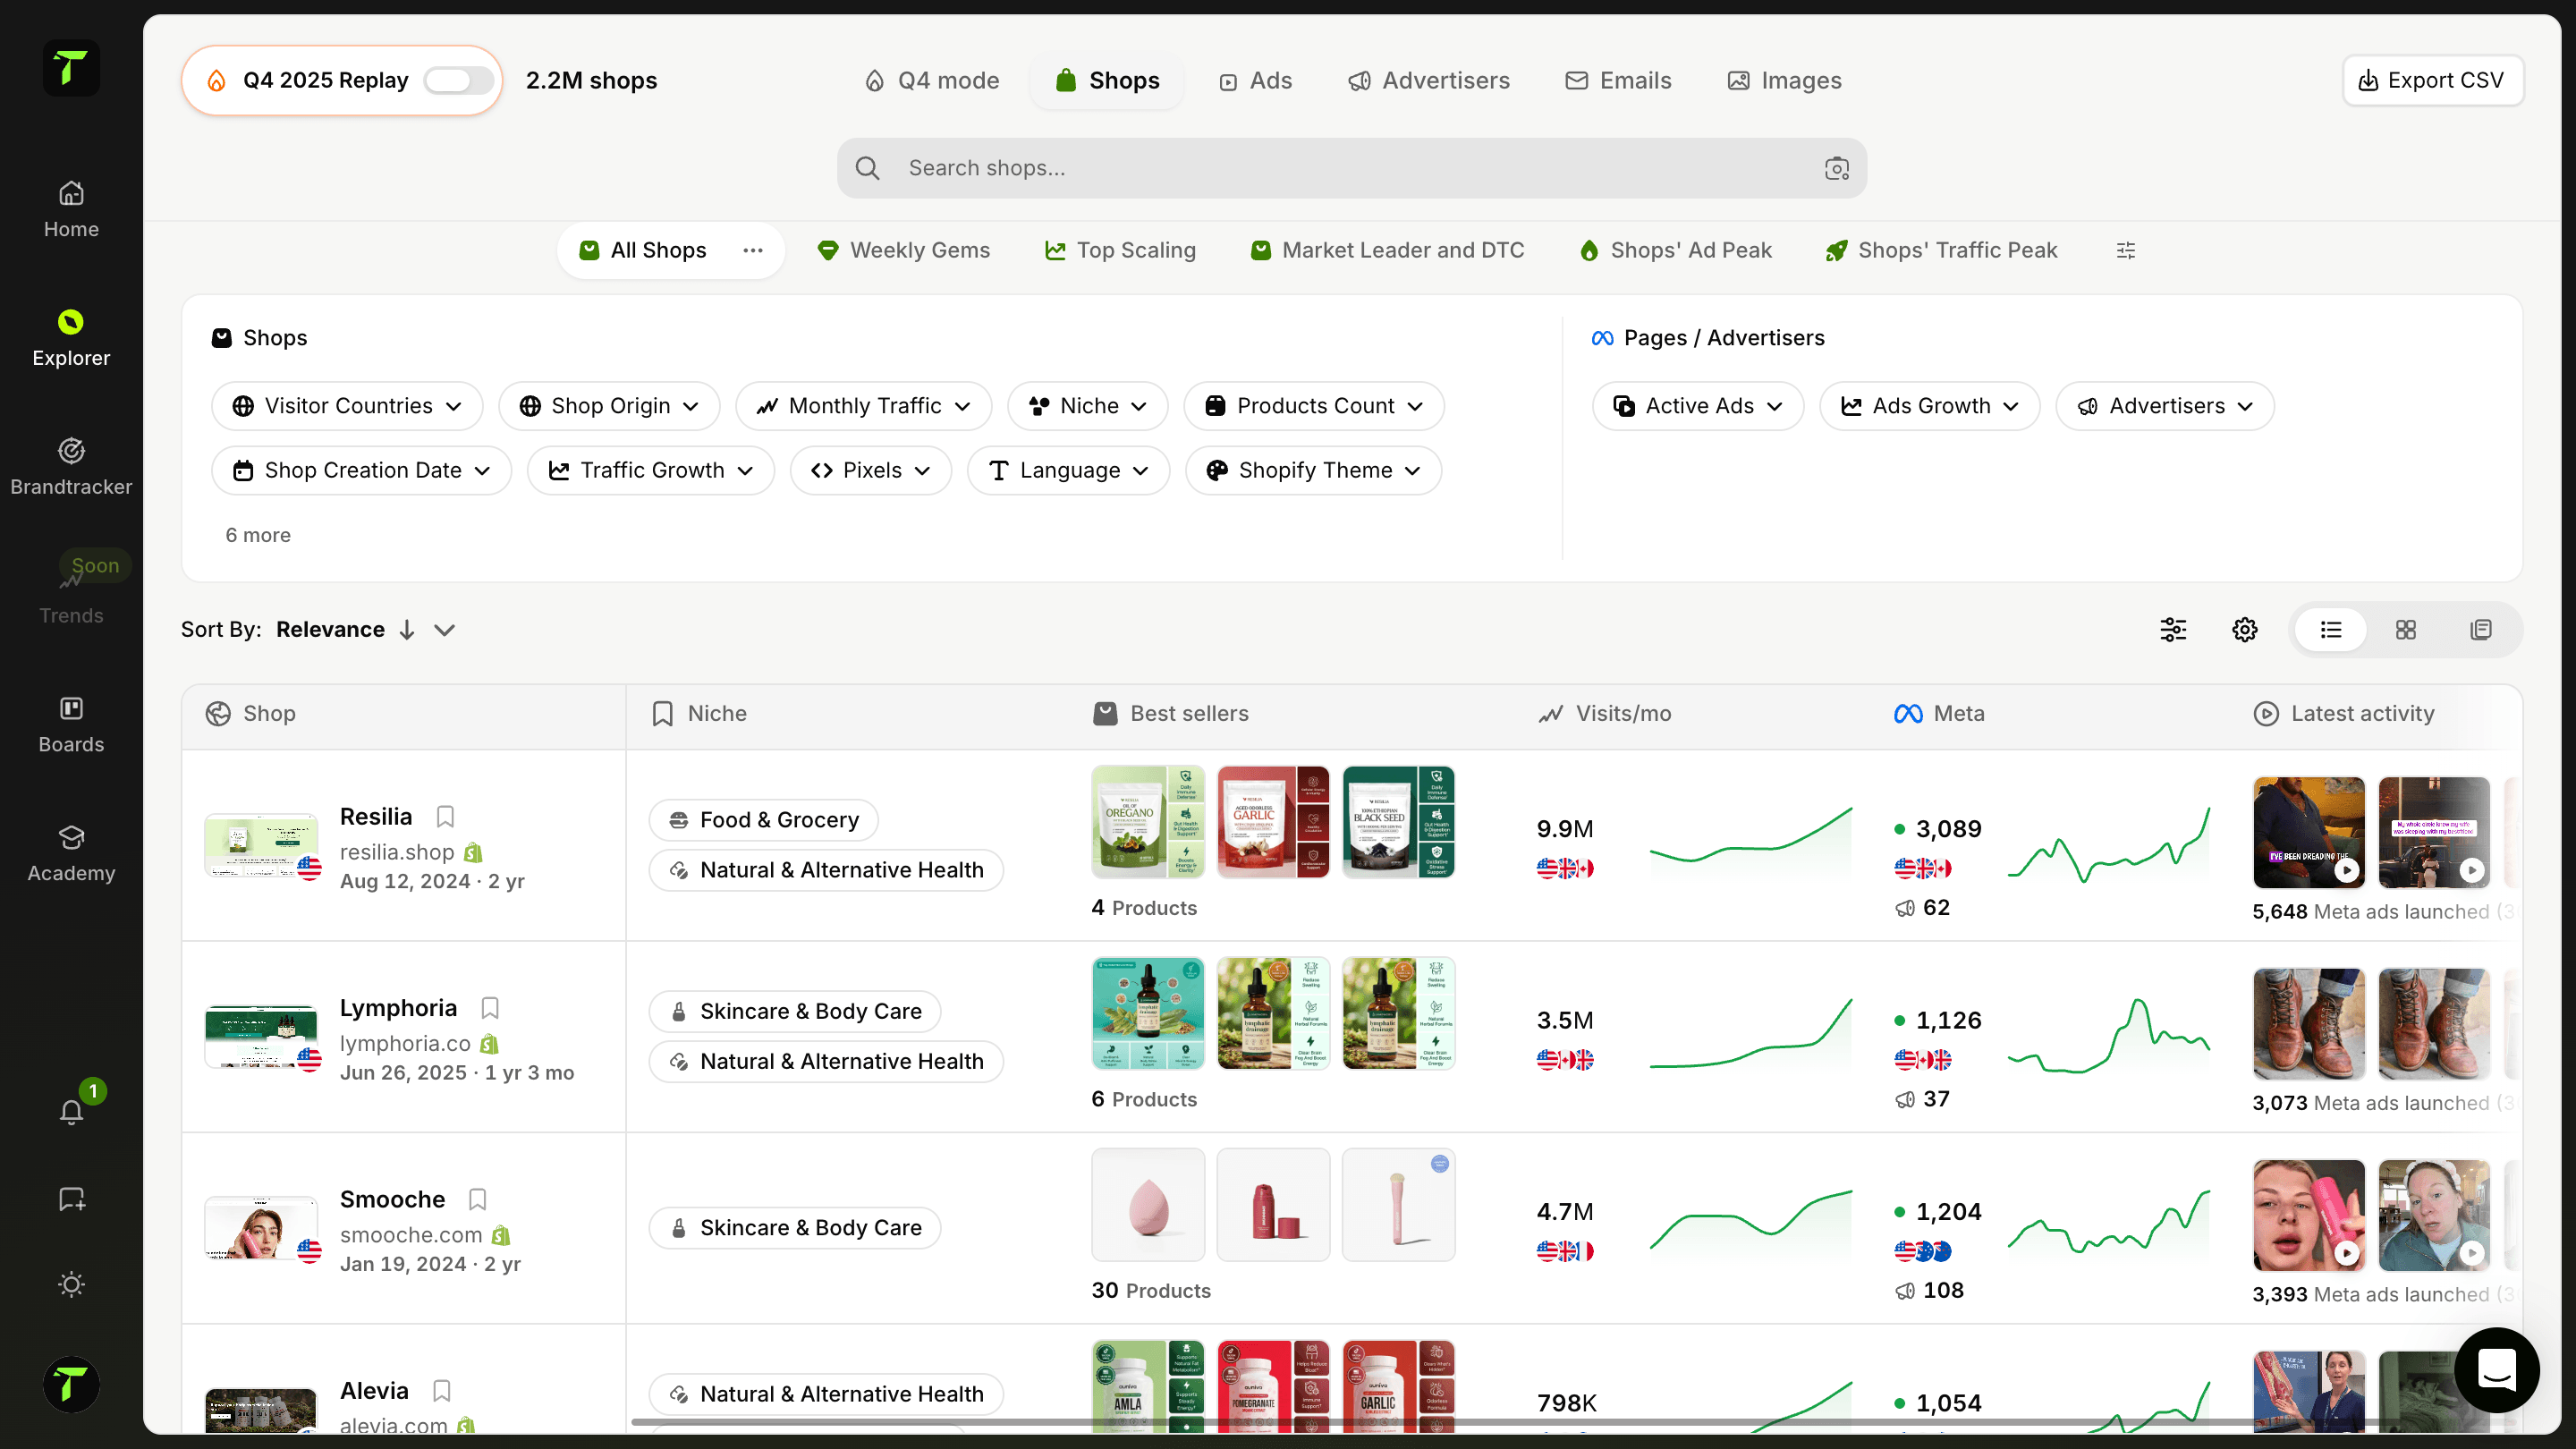
Encontra shops semelhantes à que estás a analisar
Descobre instantaneamente shops semelhantes à que estás a analisar. Compara as suas estratégias, produtos, traffic e ads para perceberes o cenário competitivo e identificares padrões entre negócios semelhantes.
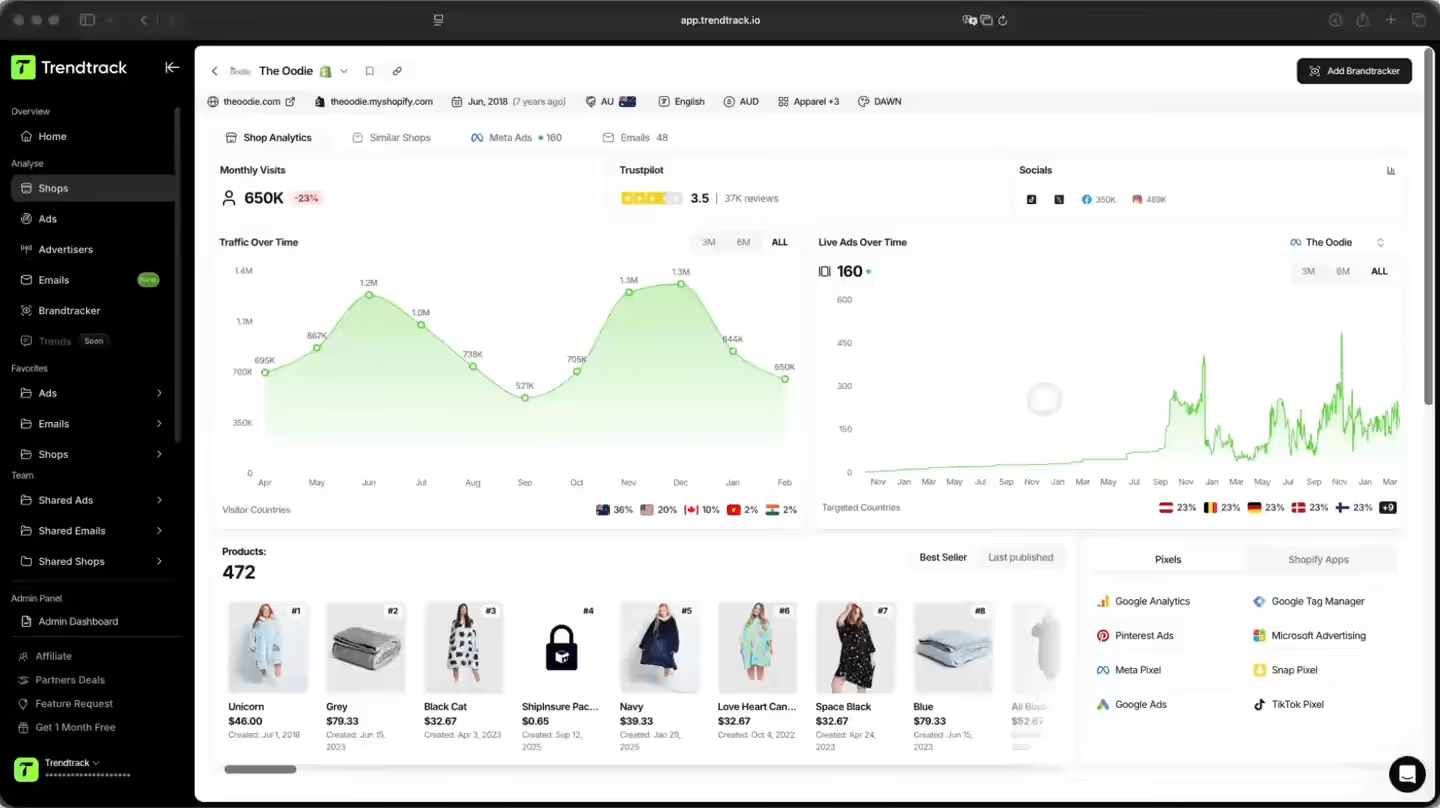
Uma forma mais inteligente de encontrar shops comparáveis
Descobre instantaneamente lojas comparáveis à que estás a analisar. Compara o seu traffic, atividade de ads, número de produtos e estratégia lado a lado para perceberes o cenário competitivo.

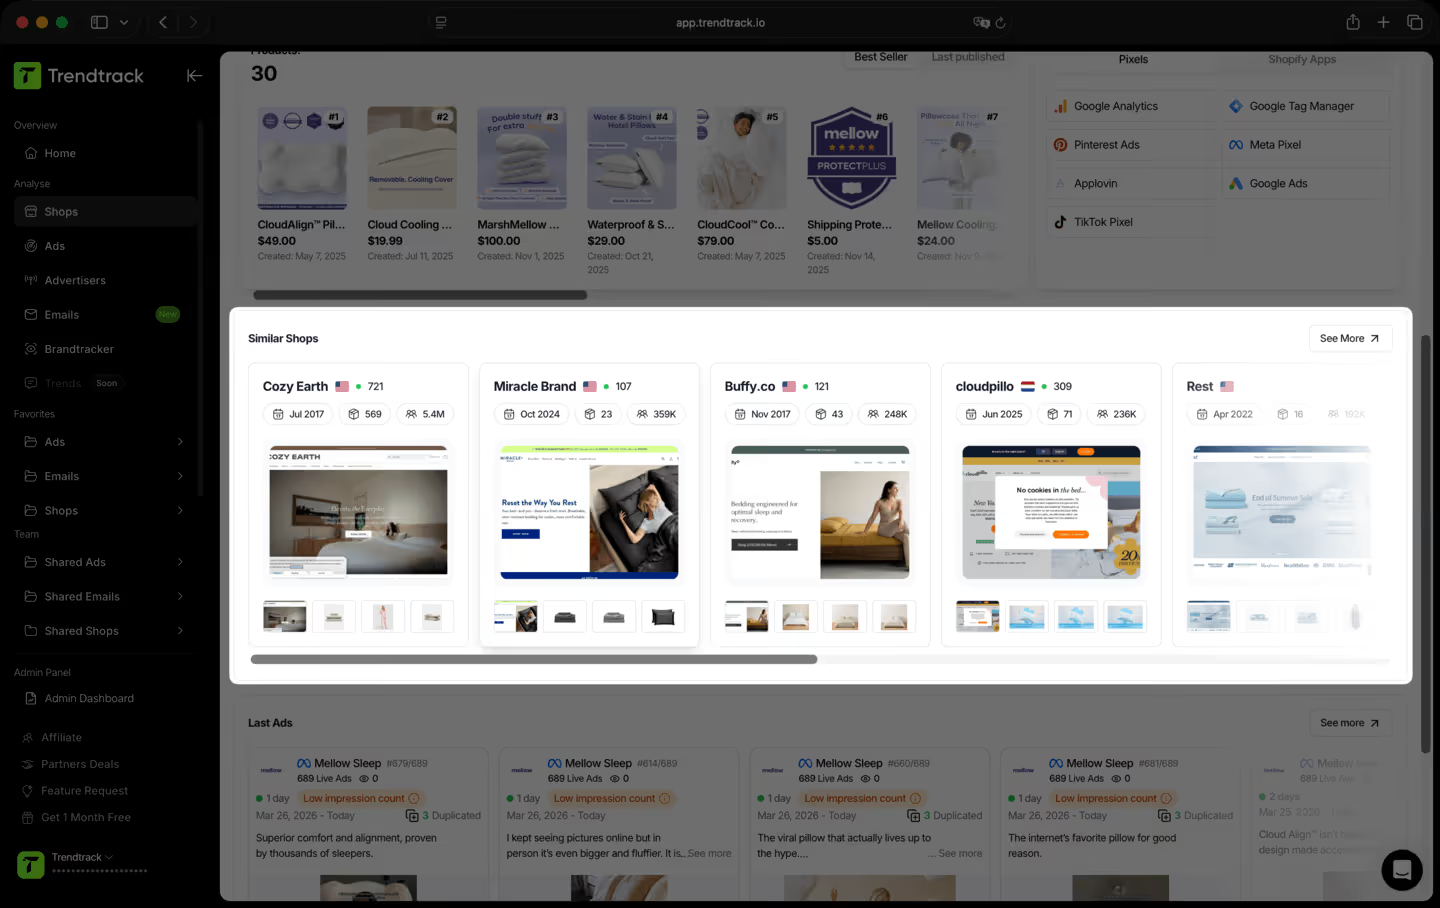
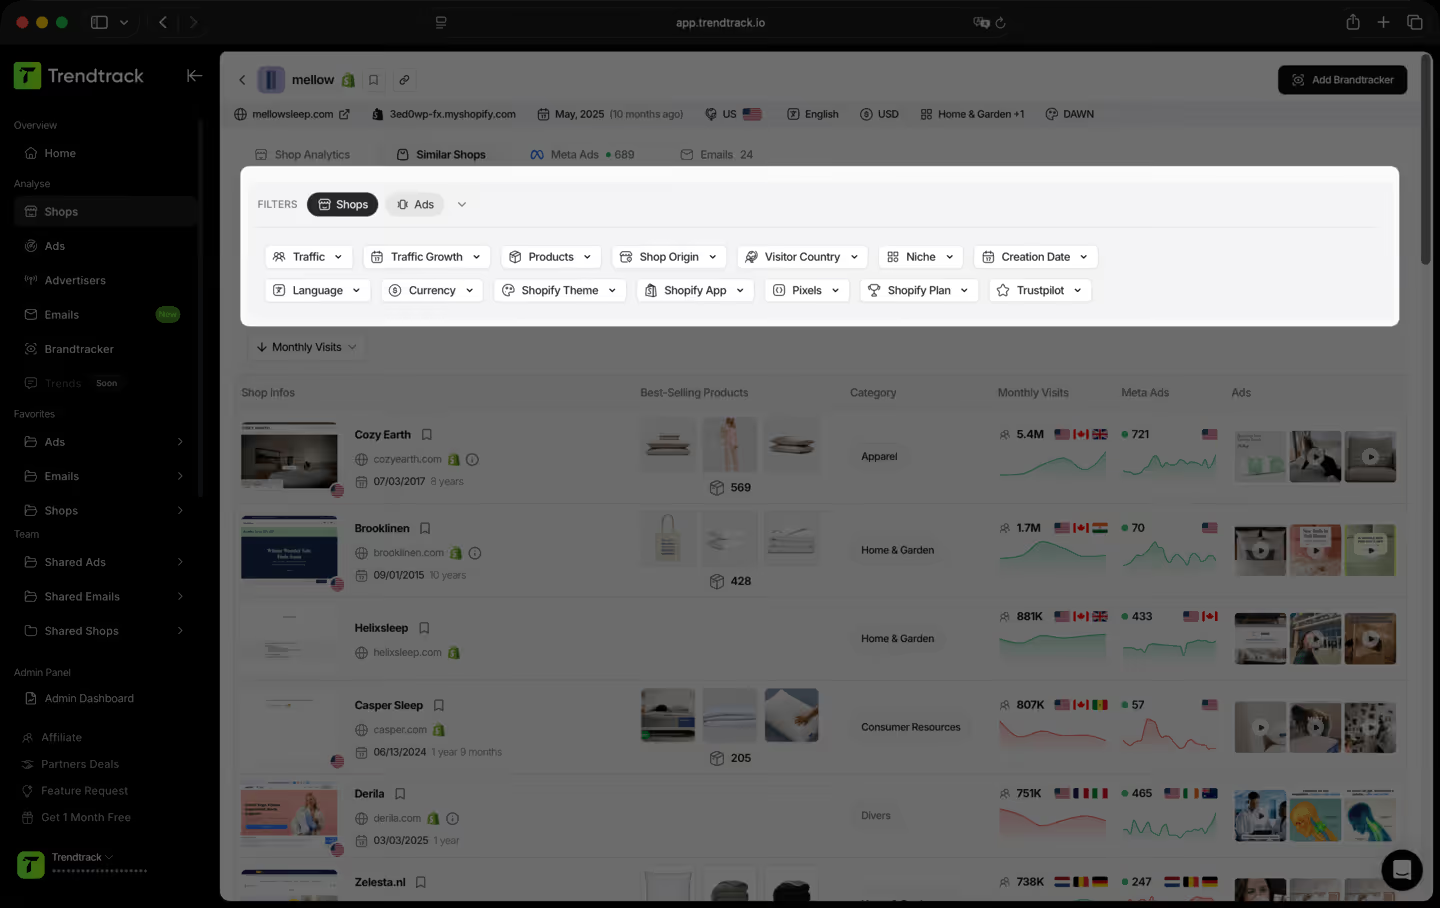
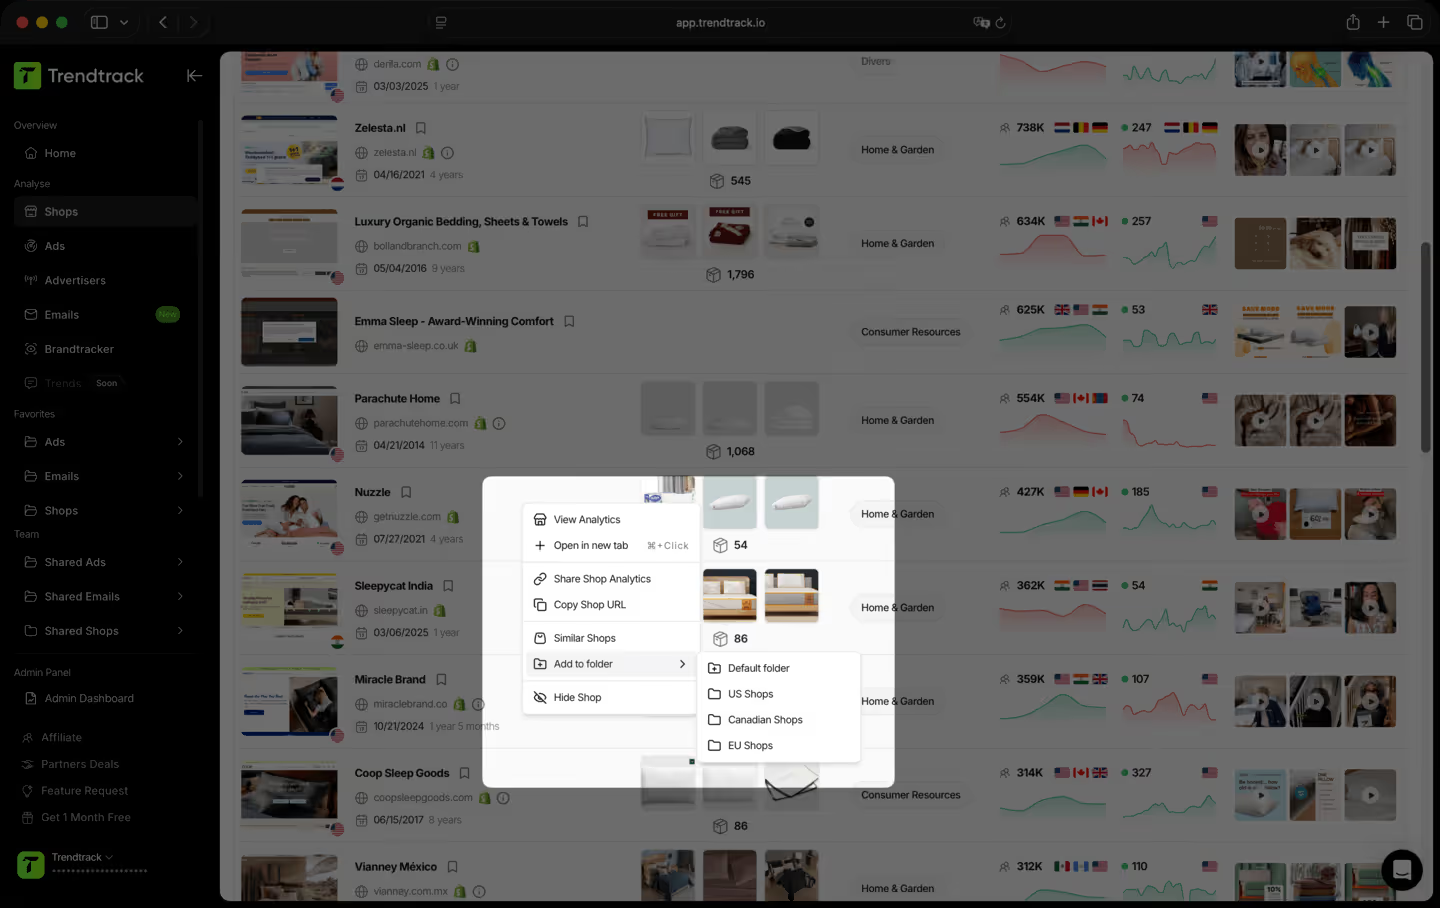
Um workflow simples para comparar shops semelhantes




A maioria das ferramentas mostra o que estava a funcionar no mês passado. Nós mostramos o que está a funcionar hoje. A nossa infraestrutura analisa todo o ecossistema Shopify e Meta diariamente, entre 2 a 3 milhões de novos anúncios indexados a cada 24 horas. Sem atrasos, sem filtros editoriais, sem escolhas subjetivas. Apenas o mercado, em tempo real.
Sim. Sem compromisso, sem fidelização. Cancela diretamente na tua conta quando quiseres.
TrendTrack é a plataforma de inteligência para e-commerce construída em torno de uma única obsessão: dar-te os dados de mercado mais precisos e mais atuais disponíveis. Cada loja, cada anúncio, cada e-mail, cada sinal de investimento, atualizado a cada 24 horas. Porque saber o que está a funcionar no e-commerce agora só é útil se "agora" significar mesmo agora.
Qualquer pessoa que toma decisões de e-commerce e não pode dar-se ao luxo de errar. Principiantes que validam um produto antes de gastar um euro. Operadores cujos anúncios estão a esgotar-se e precisam de ângulos novos. Marcas e agências que precisam de ver as mudanças do mercado antes de elas acontecerem. Se as tuas decisões dependem de saber o que está realmente a funcionar agora, esta é a ferramenta para ti.
É uma das melhores formas de reduzir o risco dos teus primeiros passos. Em vez de adivinhar, consegues ver exatamente quais produtos estão a ganhar tração, quais anúncios estão a escalar e quais nichos estão a aquecer, tudo em tempo real. Não estás a apostar num palpite. Estás a apostar em sinais de mercado reais.
Sim. A forma mais rápida de encontrar um novo ângulo é ver o que já está a funcionar, no teu nicho e além dele. O TrendTrack dá-te acesso a milhões de criativos ativos, classificados por sinais de performance, atualizados diariamente. O próximo hook vencedor já está a correr em algum lugar. Nós ajudamos-te a encontrá-lo.
Depende do teu plano. Cada plano tem os seus próprios níveis de acesso e capacidades de utilização. Antes de assinares, recomendamos que consultes a nossa página de preços para garantir que escolhes o plano que melhor se adapta às tuas necessidades.
Pronto para construir uma marca de milhões ?
.avif)