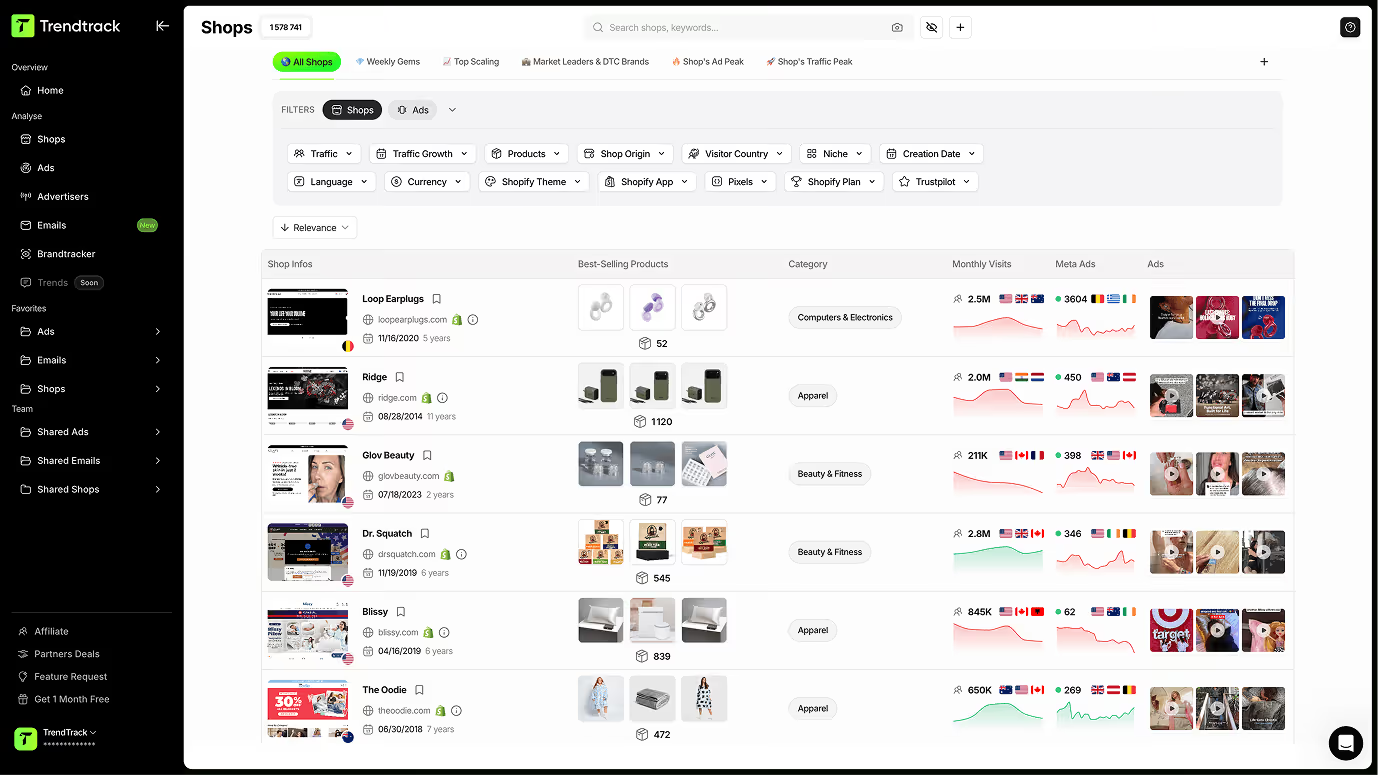
Finde Shops, die dem gerade analysierten ähnlich sind
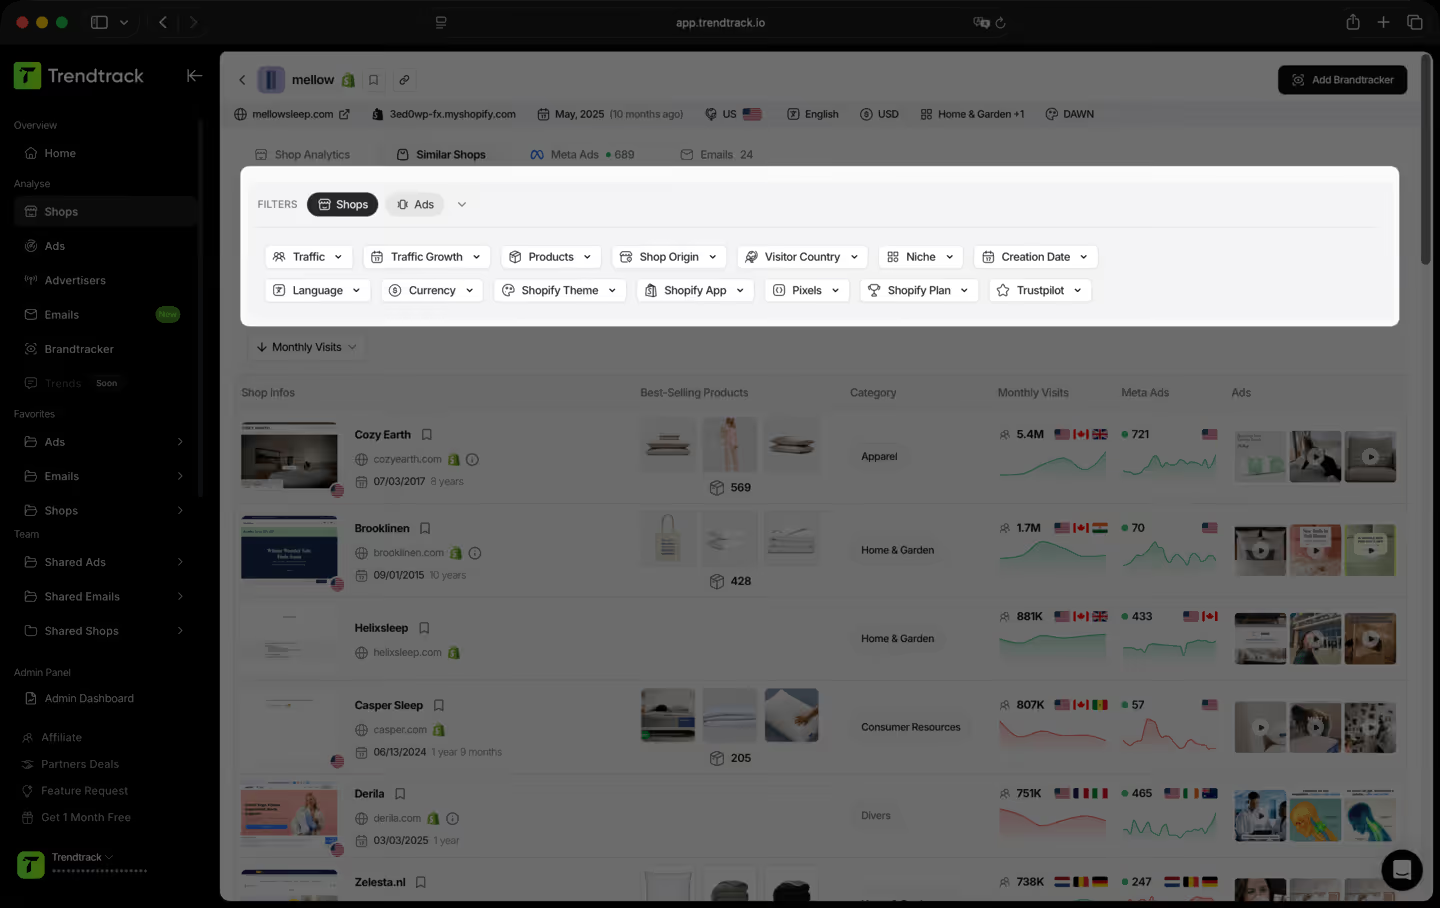
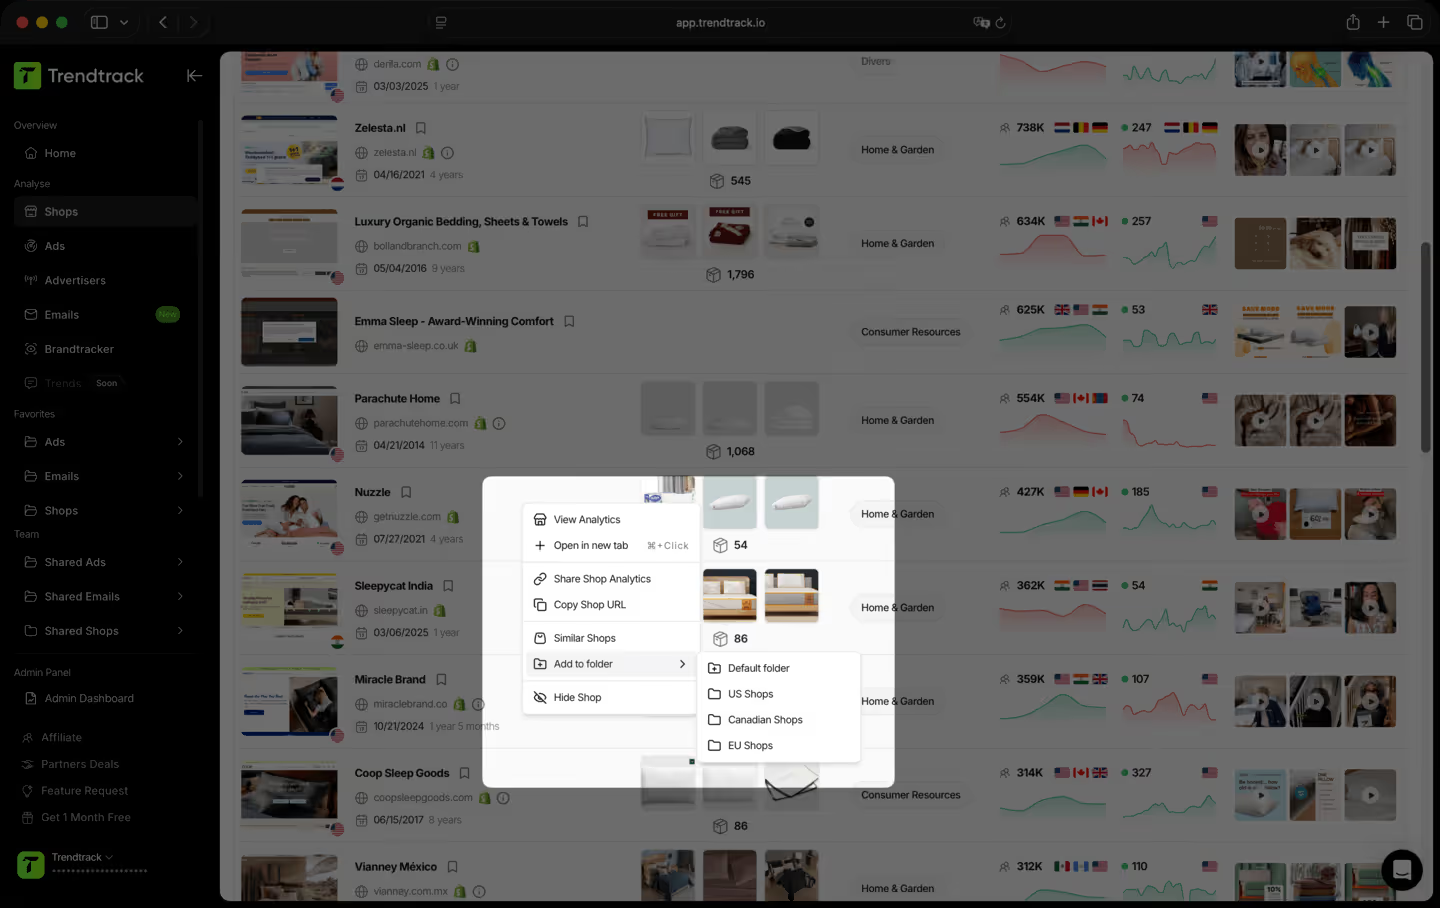
Entdecke sofort Shops, die dem gerade analysierten ähnlich sind. Vergleiche ihre Strategien, Produkte, ihren Traffic und ihre Ads, um das Wettbewerbsumfeld zu verstehen und Muster über ähnliche Unternehmen hinweg zu erkennen.
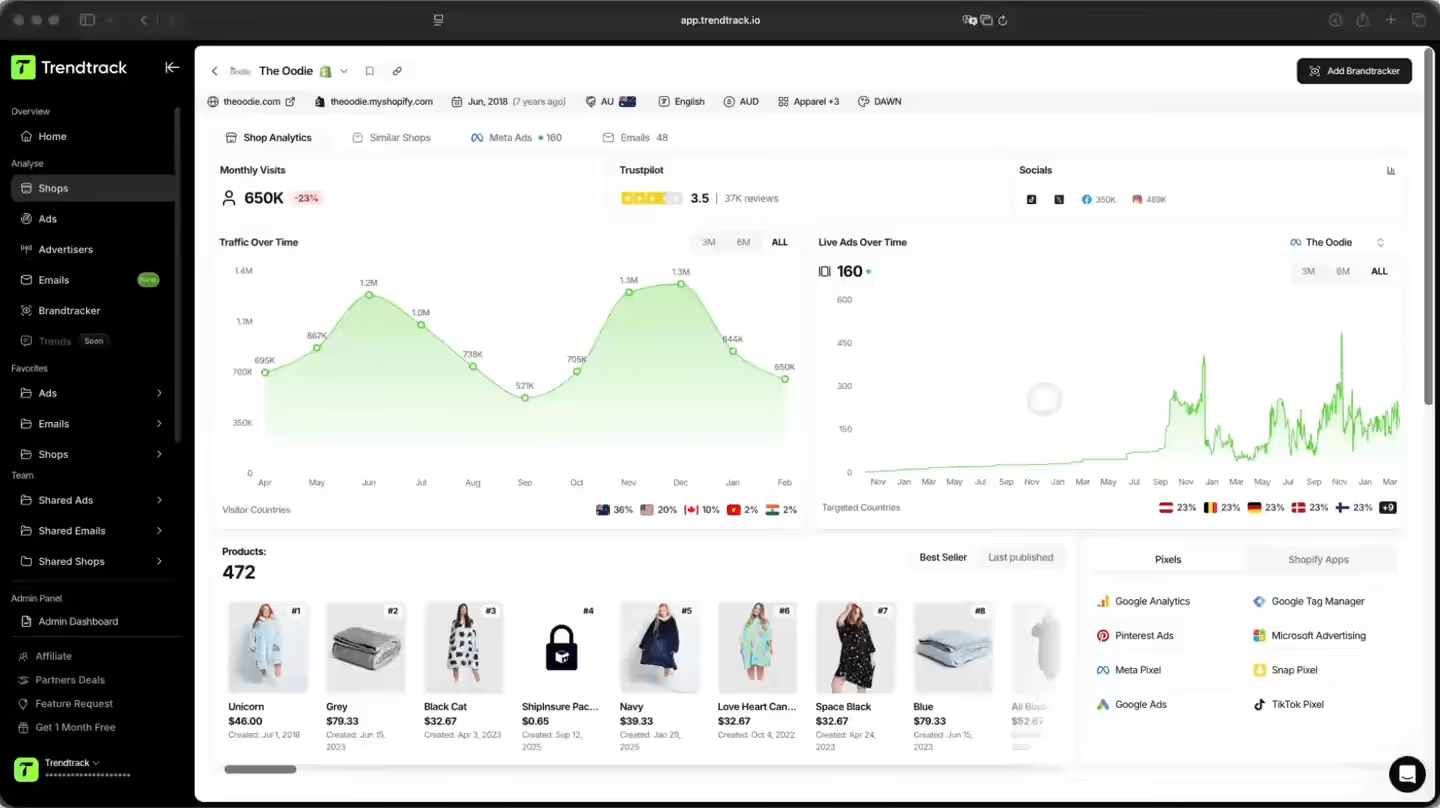
Der smartere Weg, vergleichbare Shops zu finden
Entdecke sofort Shops, die mit dem gerade analysierten vergleichbar sind. Vergleiche Traffic, Ad-Aktivität, Produktanzahl und Strategie nebeneinander, um das Wettbewerbsumfeld zu verstehen.

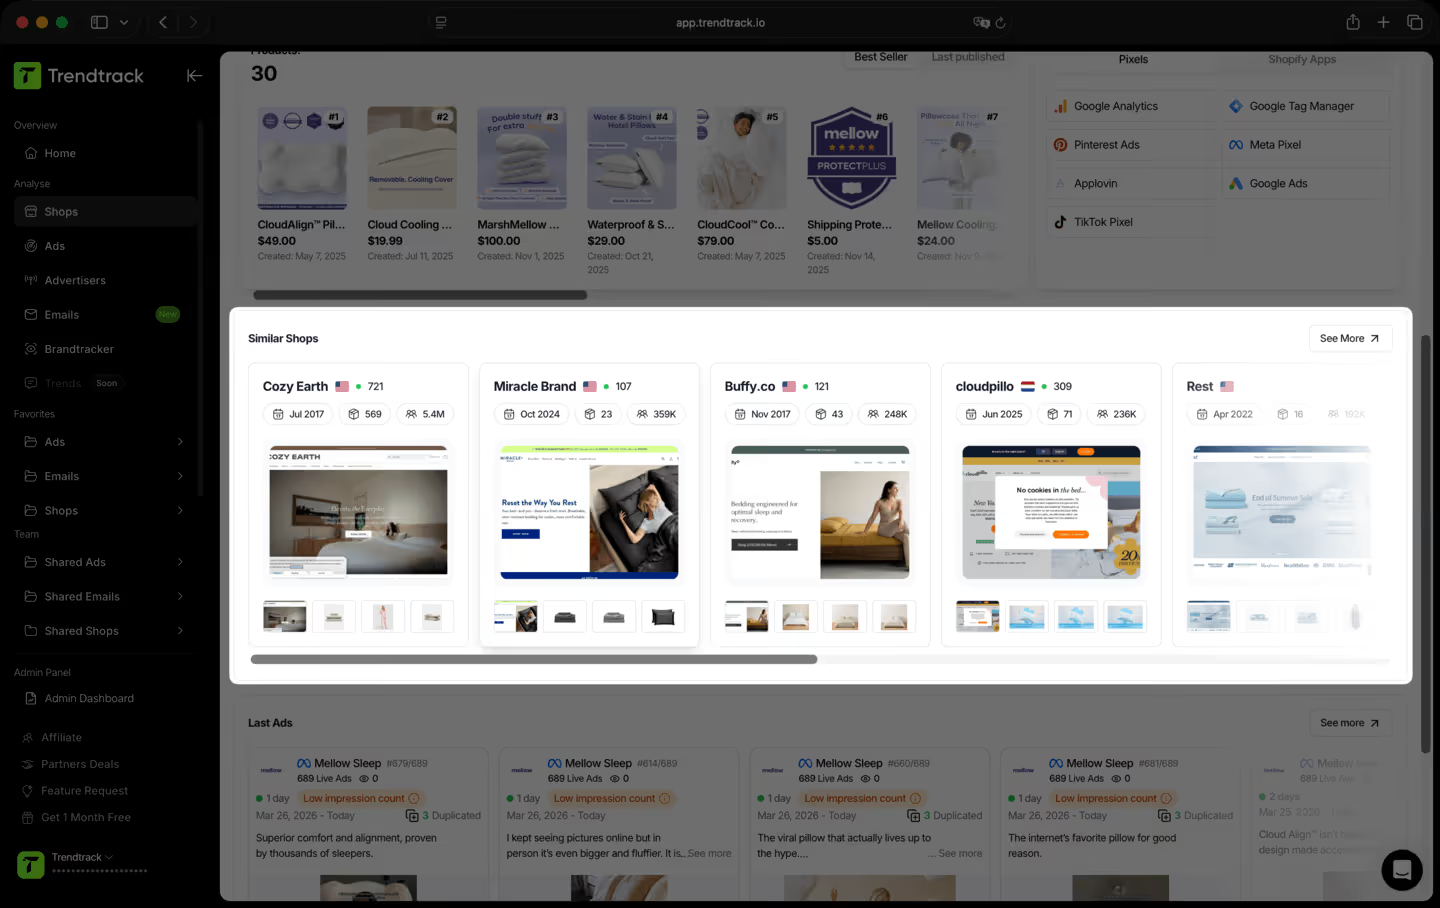
Ein einfacher Workflow, um ähnliche Shops zu vergleichen


Häufig gestellte Fragen
Du findest keine Antwort auf deine Frage?
Kontaktiere uns, indem du hier klickst.
Die meisten Tools zeigen dir, was letzten Monat funktioniert hat. Wir zeigen dir, was heute funktioniert. Unsere Infrastruktur scannt täglich das gesamte Shopify- und Meta-Ökosystem – 2 bis 3 Millionen neue Anzeigen werden alle 24 Stunden indexiert. Keine Verzögerungen, keine redaktionellen Filter, keine subjektive Auswahl. Einfach der Markt, live.
Ja. Keine Verpflichtung, keine Vertragsbindung. Kündige jederzeit direkt über dein Konto.
TrendTrack ist die E-Commerce-Intelligence-Plattform, die sich einer Sache verschrieben hat: dir die genauesten und aktuellsten Marktdaten zu liefern, die es gibt. Jeder Store, jede Anzeige, jede Mail, jedes Spend-Signal – alle 24 Stunden aktualisiert. Denn zu wissen, was im E-Commerce gerade richtig läuft, bringt dir nur etwas, wenn "gerade" auch wirklich gerade bedeutet.
Für alle, die E-Commerce-Entscheidungen treffen und sich keine Fehler leisten können. Einsteiger, die ein Produkt validieren, bevor sie einen Euro ausgeben. Operator, deren Ads ausbrennen und die frische Angles brauchen. Brands und Agenturen, die Marktverschiebungen erkennen müssen, bevor sie eintreten. Wenn deine Entscheidungen davon abhängen, zu wissen, was gerade wirklich funktioniert, ist das dein Tool.
Das ist eine der besten Möglichkeiten, deine ersten Schritte risikoärmer zu gestalten. Statt zu raten, siehst du genau, welche Produkte an Zugkraft gewinnen, welche Anzeigen skalieren und welche Nischen gerade richtig abgehen, alles in Echtzeit. Du verlässt dich nicht auf ein Bauchgefühl. Du verlässt dich auf live Marktsignale.
Ja. Der schnellste Weg, einen neuen Winkel zu finden, ist zu sehen, was bereits funktioniert – in deiner Nische und darüber hinaus. TrendTrack gibt dir Zugriff auf Millionen aktiver Creatives, sortiert nach Performance-Signalen und täglich aktualisiert. Der nächste erfolgreiche Hook läuft irgendwo schon. Wir helfen dir, ihn zu finden.
Das hängt von deinem Plan ab. Jeder Plan verfügt über eigene Zugriffsrechte und Nutzungsmöglichkeiten. Bevor du dich anmeldest, empfehlen wir dir, unsere Preisseite zu checken, um sicherzustellen, dass du den Plan wählst, der zu deinen Bedürfnissen passt.
Bereit, eine Millionen-Marke aufzubauen?
.avif)