
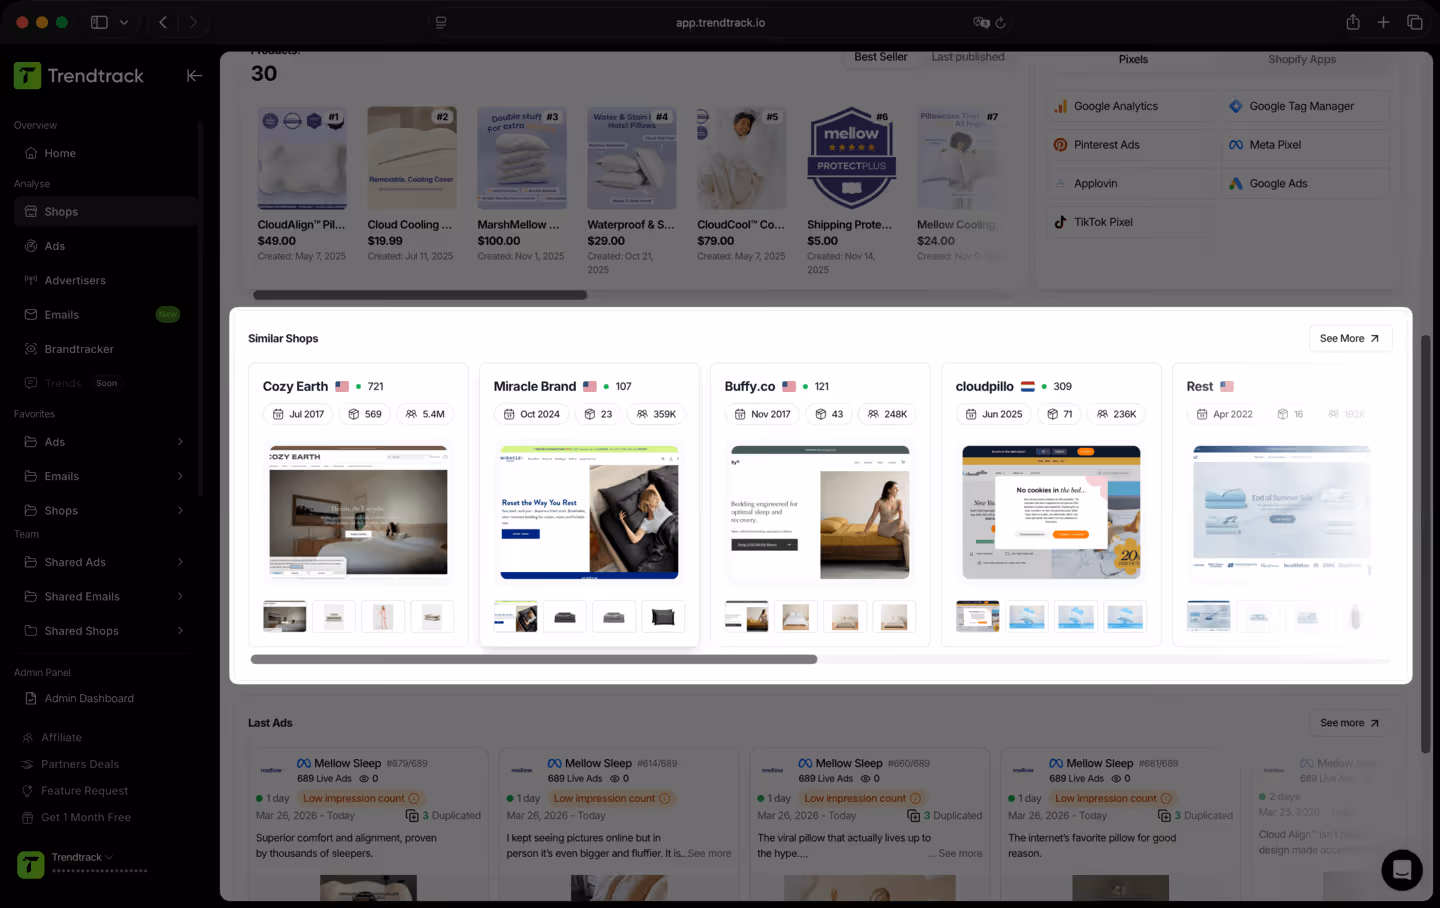
Trouvez des shops similaires à celui que vous analysez
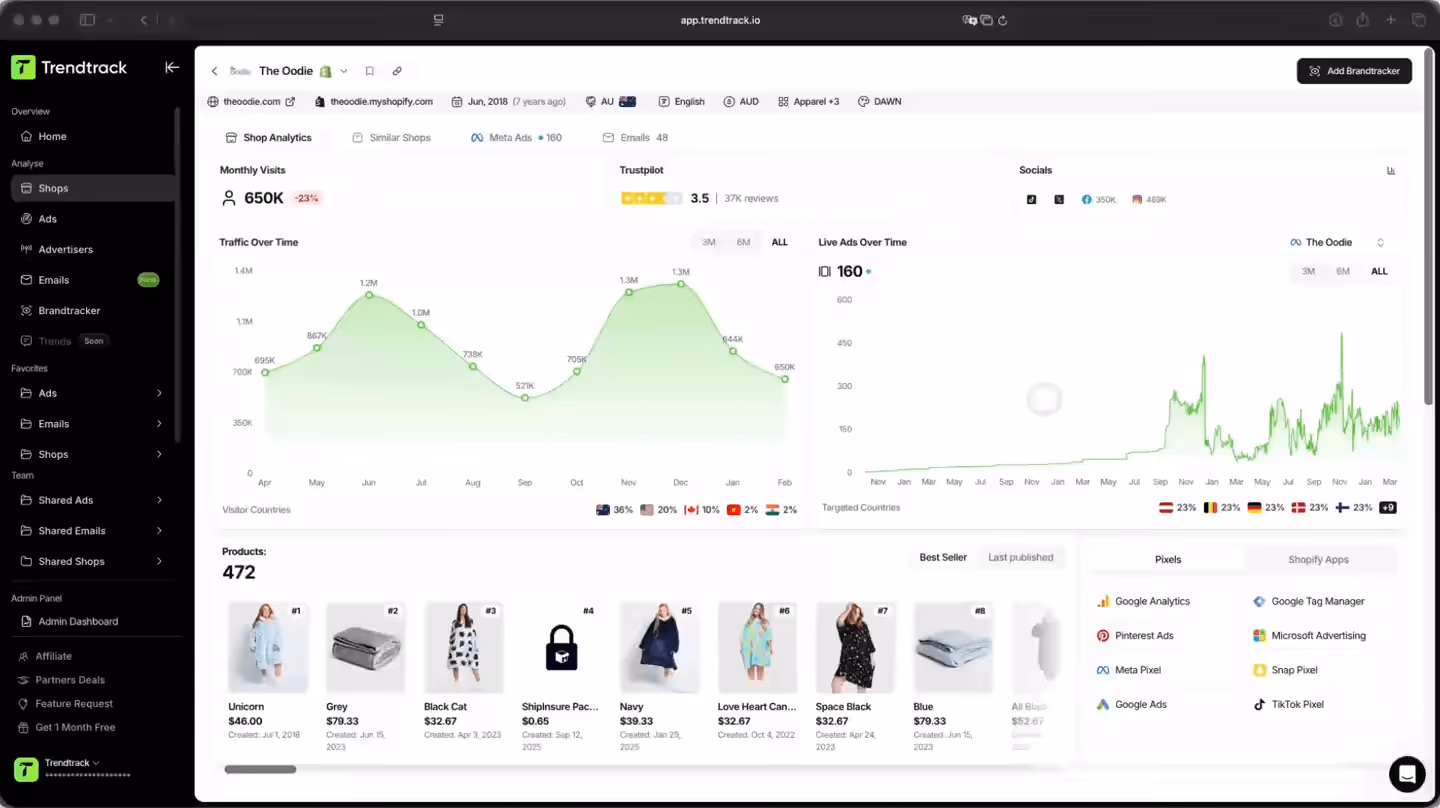
Découvrez instantanément des shops similaires à celui que vous êtes en train d'analyser. Comparez leurs stratégies, produits, trafic et ads pour comprendre le paysage concurrentiel et repérer les patterns entre business similaires.
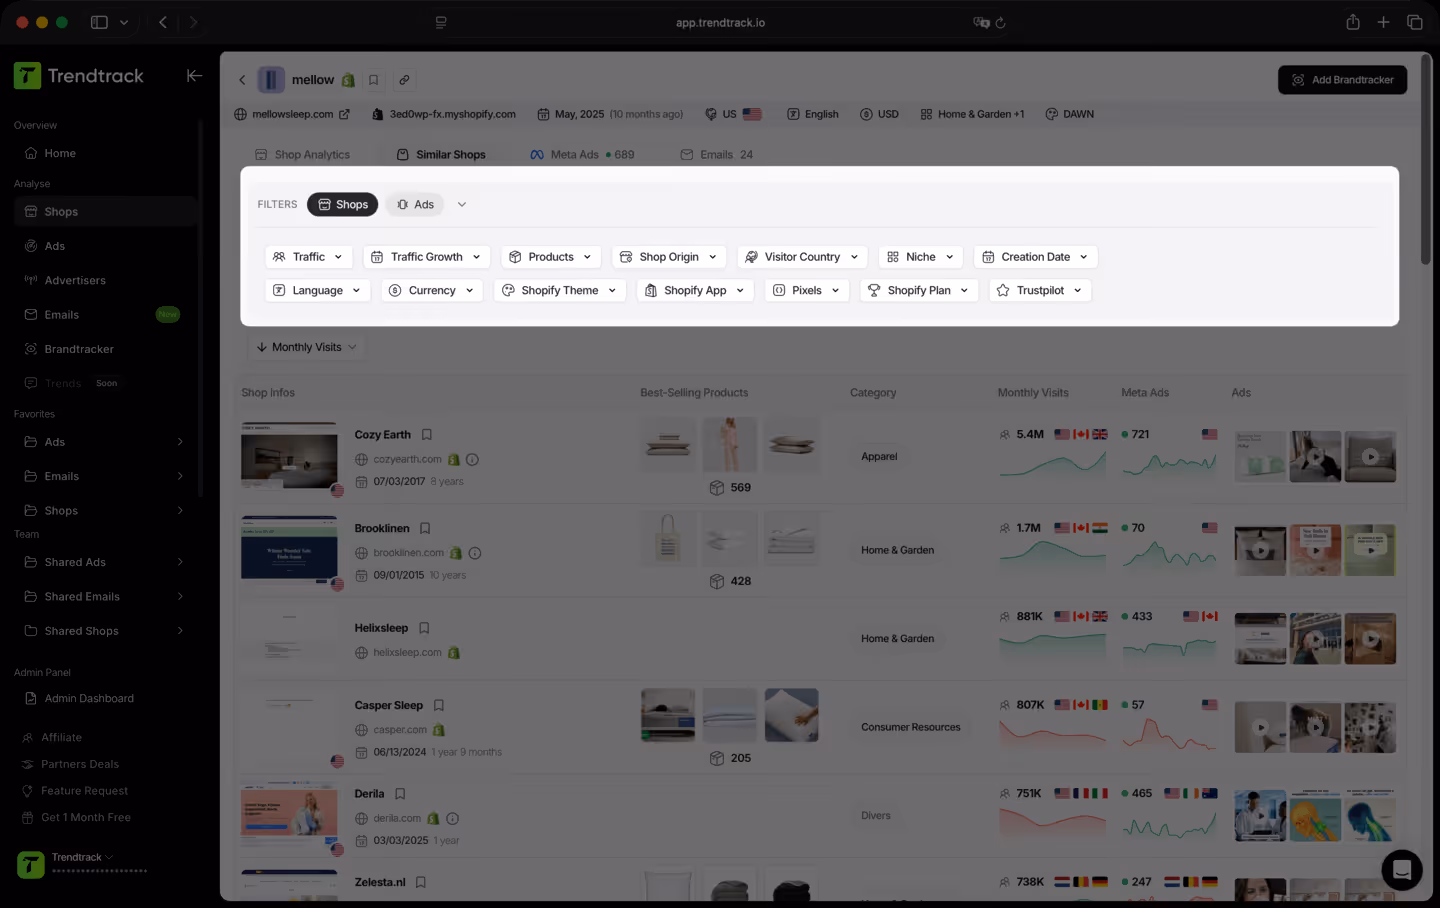
Une façon plus maligne de trouver des shops comparables
Découvrez instantanément des stores comparables à celui que vous analysez. Comparez leur trafic, leur activité publicitaire, leur nombre de produits et leur stratégie côte à côte pour comprendre le paysage concurrentiel.

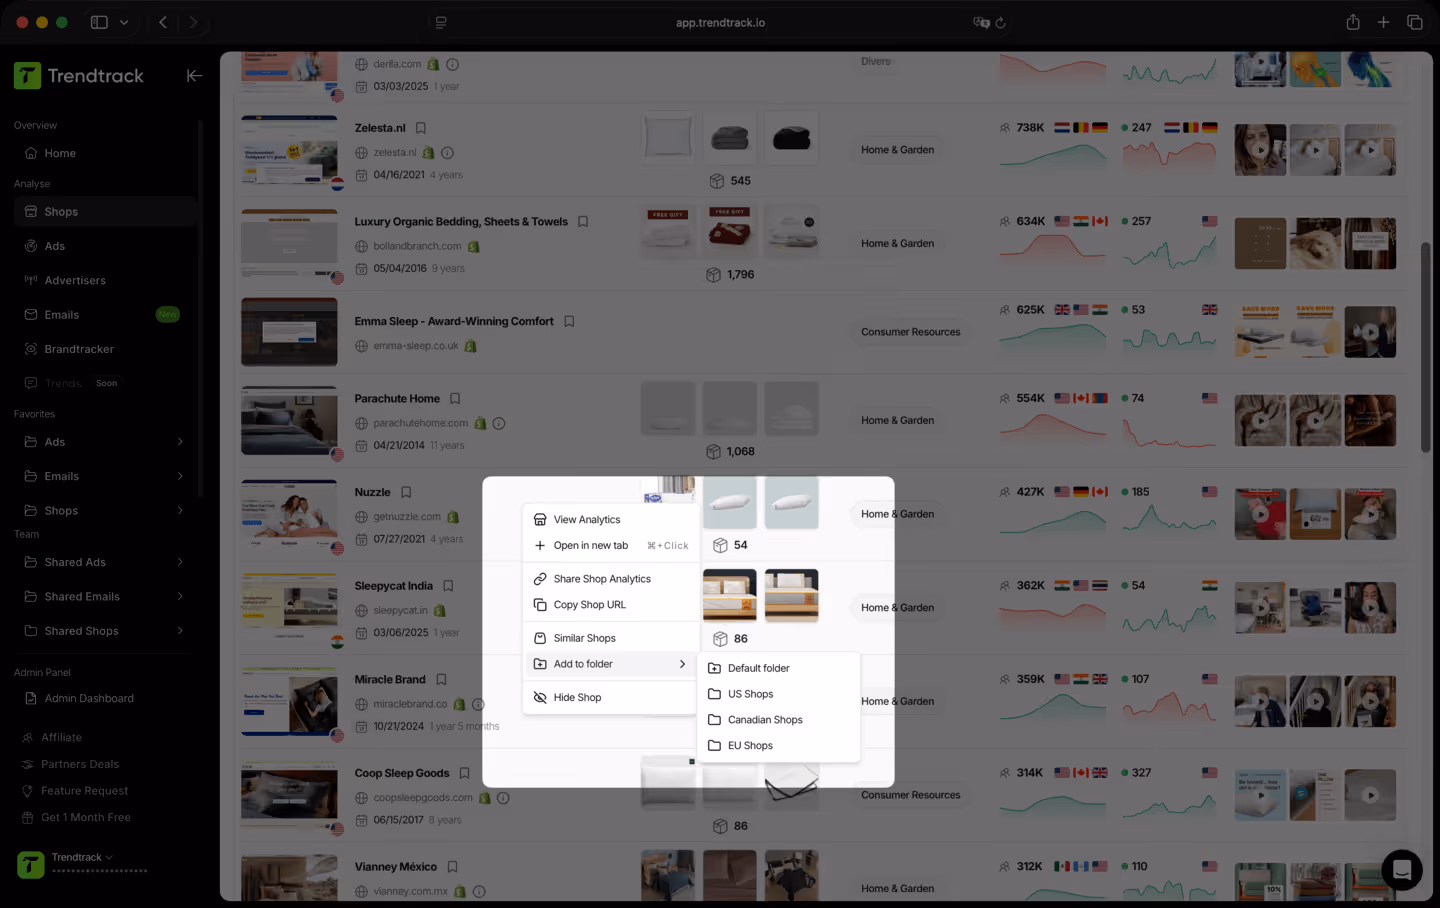
Un workflow simple pour comparer des shops similaires


Les questions fréquentes
Vous ne trouvez pas la réponse à votre question ? Contactez-nous en cliquant ici..
TrendTrack est la plateforme d'intelligence ecommerce construite autour d'une obsession : vous donner la data marché la plus précise et la plus à jour possible. Chaque store, chaque ad, chaque mail, chaque signal de spend, mis à jour toutes les 24h. Parce que savoir ce qui cartonne en ecom en ce moment n'a de valeur que si "en ce moment" veut vraiment dire en ce moment.
La plupart des outils vous montrent ce qui marchait le mois dernier. Nous, on vous montre ce qui marche aujourd'hui. Notre infrastructure scanne l'ensemble de l'écosystème Shopify et Meta quotidiennement — 2 à 3 millions de nouvelles ads indexées toutes les 24h. Pas de délai, pas de filtre éditorial, pas de sélection subjective. Juste le marché, en live.
A tous ceux qui prennent des décisions en ecom et qui ne peuvent pas se permettre de se tromper. Les débutants qui valident un produit avant de dépenser un centime. Les opérateurs dont les ads s'essoufflent et qui ont besoin de nouveaux angles. Les marques et agences qui doivent voir les mouvements du marché avant qu'ils n'arrivent. Si vos décisions dépendent de savoir ce qui fonctionne vraiment en ce moment, c'est votre outil.
C'est l'un des meilleurs moyens de réduire le risque sur vos premiers moves. Au lieu de deviner, vous pouvez voir exactement quels produits gagnent en traction, quelles ads scalent et quelles niches chauffent — le tout en temps réel. Vous ne pariez pas sur une intuition. Vous pariez sur des signaux marché en direct.
Oui. Le moyen le plus rapide de trouver un nouvel angle, c'est de voir ce qui fonctionne déjà — dans votre niche et au-delà. TrendTrack vous donne accès à des millions de créas actives, classées par signaux de performance, mises à jour quotidiennement. Le prochain hook gagnant tourne déjà quelque part. On vous aide à le trouver.
Toutes nos données proviennent directement de sources réelles — pas de chiffres inventés, pas d'estimations sorties de nulle part. Le spend publicitaire est sourcé directement depuis les données de Meta. Le trafic des stores est alimenté par SimilarWeb, le fournisseur d'intelligence trafic le plus fiable du marché. Rafraîchies toutes les 24h, ces données vous donnent la lecture la plus précise de ce qui scale en ce moment — assez solide pour repérer les winners, tracker les marques émergentes et détecter les tendances avant qu'elles ne peakent.
Ça dépend de votre plan. Chaque plan a ses propres niveaux d'accès et capacités d'utilisation. Avant de souscrire, on vous recommande de consulter notre page pricing pour choisir le plan qui correspond à vos besoins.
Oui. Pas d'engagement, pas de verrouillage. Annulez directement depuis votre compte quand vous voulez.
Prêt à construire une marque à plusieurs millions ?
.avif)
