How to Find Trending Products on Facebook in 2026


A winning product on Facebook is not just entertaining in videos. It’s something people keep buying because it solves a real problem or fits a specific niche. Viral spikes may look appealing but often lead to leftover inventory issues.
Your goal is simple. Find a product with steady demand so ads can run long enough to test and optimize creative efficiently. The key signal is evidence that someone can scale the product consistently.
Use engagement as a trend indicator

Facebook engagement can be noisy. Treat it as a diagnostic tool. Look beyond simple likes. Pay attention to engagement that shows real buyer interest and staying power. A clear sign is ads that keep running, indicating the economics work. Here are practical interpretations of common signals:
- Lots of comments (especially questions): Shows curiosity and buying friction. This indicates demand and highlights what to improve in creative or the landing page.
- Shares: Suggests people find the product useful or necessary, pointing to wider appeal beyond impulse buying.
- Saves: Reflects high intent or comparison shopping. Saved posts often mean customers plan to purchase later.
- Multiple similar creatives for the same product: Demonstrates that brands are iterating, not randomly repeating ads. This means profitability.
- Ad longevity (days running): Confirms the business model is holding up. Ads running for many days typically show sustainable demand.
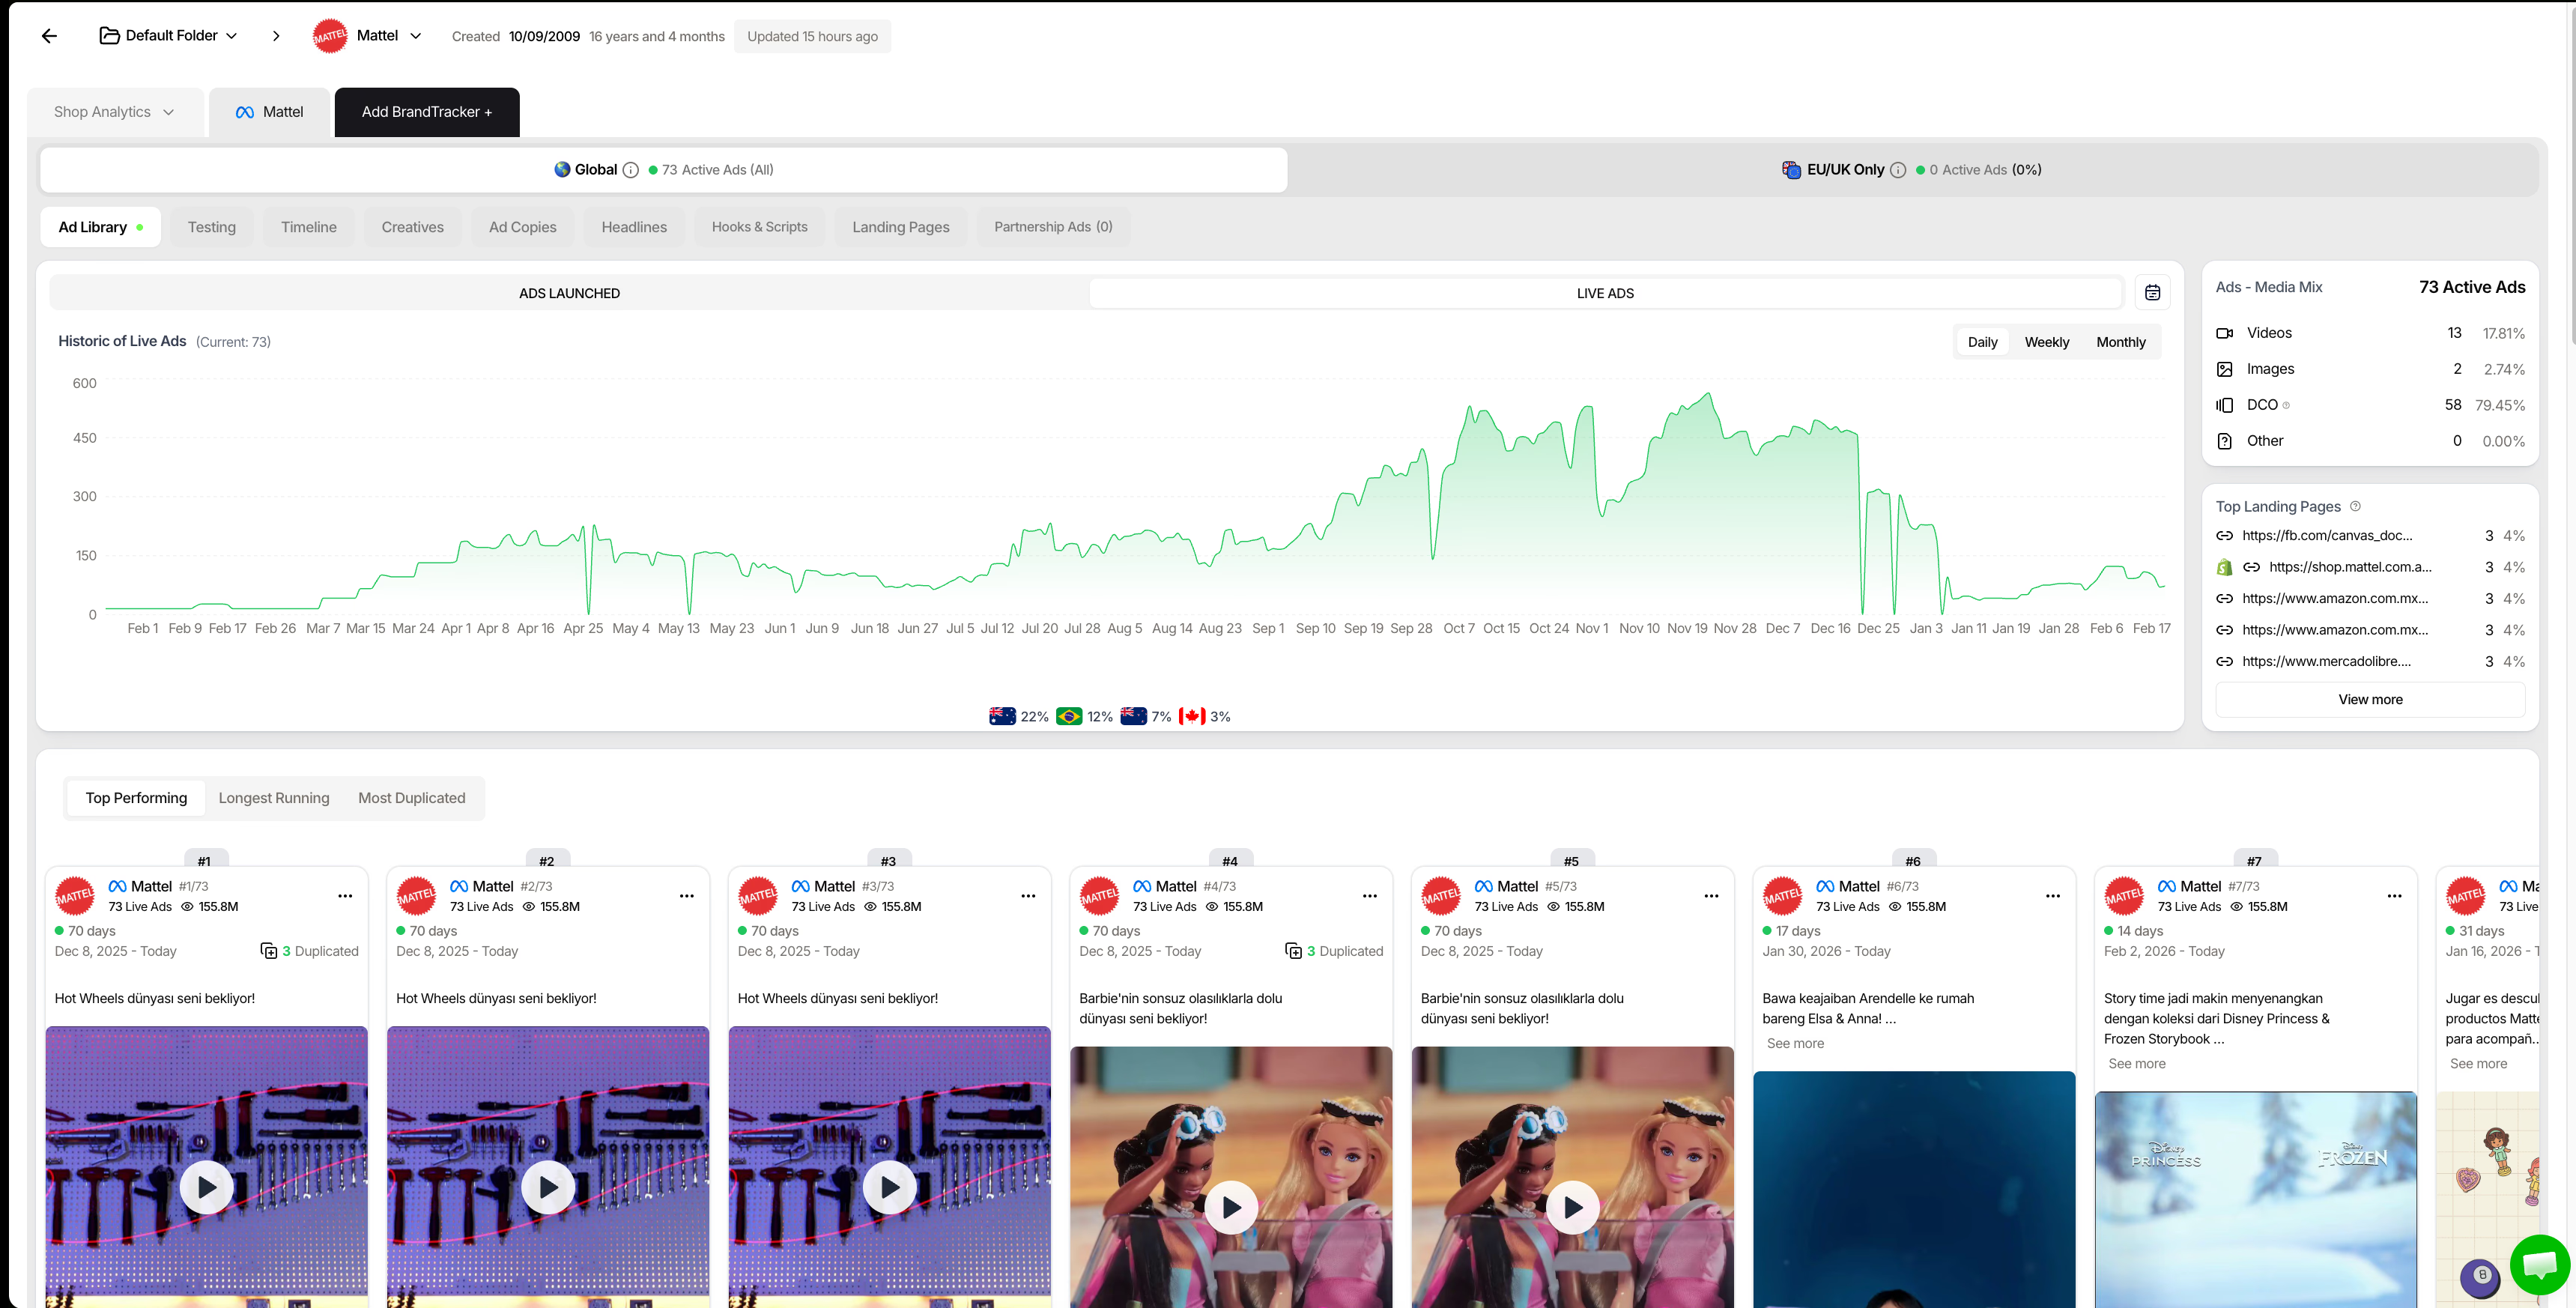
Trendtrack measures ad longevity by letting you filter ads based on how long they’ve been running and how many duplicates exist. That helps identify brands improving their messaging aggressively.
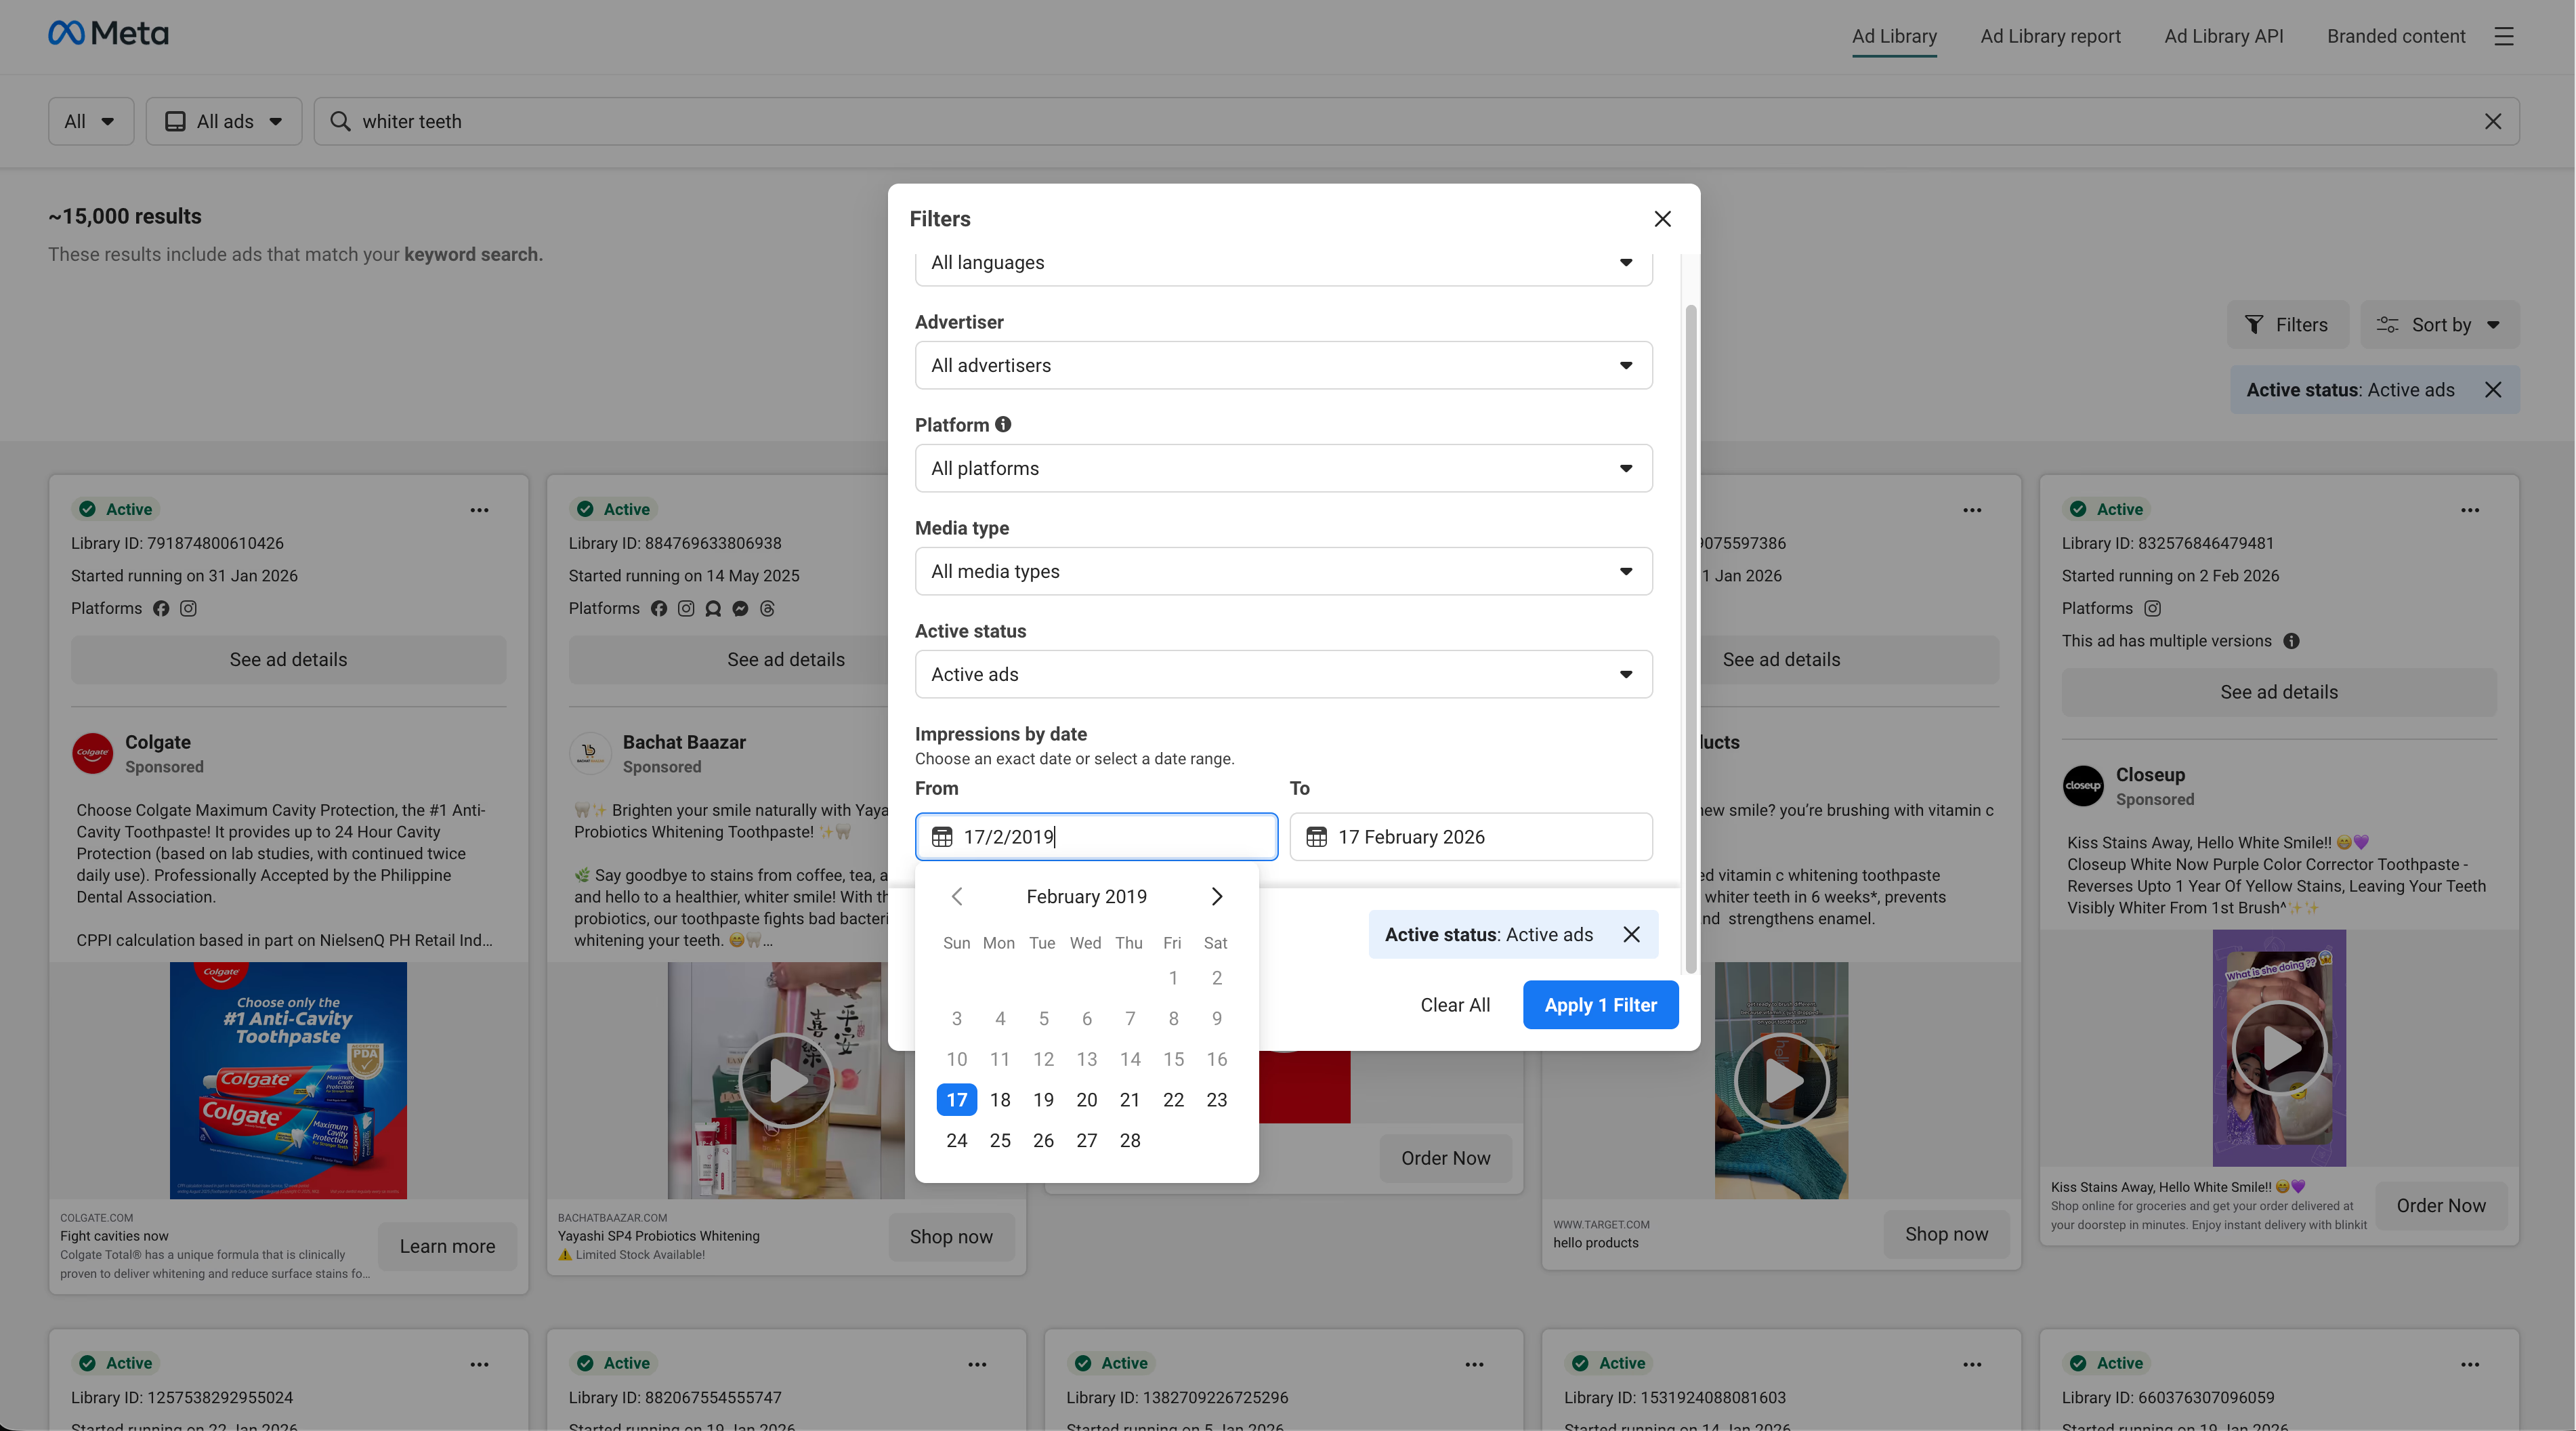
A simple tactic is to filter for Active ads running at least 30 days, which often signals proven performance.
Balance demand vs saturation
Trending products can still be poor choices if the market becomes flooded with similar offers. The real problem isn't competition itself. Instead, you enter a space where every ad looks identical and price becomes the only differentiator.
Measure saturation by counting how many competitors are actively scaling with similar creatives:
- More than 50 competitors often means the market is too crowded. Margins shrink and competition intensifies.
- The ideal early spot has fewer than 10 stores actively scaling ads for the product. Here, you can win by improving creative and positioning.
Avoid wasting time scrolling product-by-product. Instead, hunt store-by-store and identify products by spotting patterns in store activity. Trendtrack helps by providing two approaches depending on your goal:
- To find momentum, filter shops with ad spend growth over 20% in 30 days.
- To find low-competition opportunities, target newer pages (created within 6 months) that are currently spending.
A useful edge is recognizing weak or generic when you track competitor ads. This means strong demand with poor creative execution, a prime opportunity for entry.
Check unit economics early
Even with strong demand, product trends can fail financially. Always run a quick unit economics check before investing in creative or testing. Focus on three key numbers determining profitability:
- Profit margin: Aim for at least a 3x markup (buy at $10, sell at $30).
- Shipping costs: Compact, lightweight products tend to protect margins and conversion rates.
- Break-even cost: The maximum you can spend to acquire a customer without losing money.
Here’s an example calculation:
If your ads cost $20 per acquisition, the product isn't profitable despite popularity. Learning how to calculate Facebook ads budget properly can help you avoid these costly mistakes. Additional checks to avoid costly mistakes:
- Oversized shipping fees can increase by 40–60%, forcing you to eat margins or increase prices, which hurts conversion.
- Unexpected checkout costs cause over 22% of shoppers to abandon carts, with nearly 18% quitting due to slow shipping.
In summary, engagement matters but don’t rely on it alone. Focus on products with sustained demand, proven ad scaling, manageable competition, and solid unit economics before you commit. This approach lets you validate ideas with data, not guesswork.
Want to ensure your product choice actually pencils out? Use a profit margin calculator to stress-test your unit economics before scaling ads—it only takes a few minutes and can save you thousands.
How to find trending products on Facebook with Meta Ad Library
If you use Meta Ad Library without focus, you’ll keep seeing the same “winners” everyone already copied. Instead, use it like a radar. Narrow your search, isolate a pattern, then expand only when the pattern holds.

Start by picking one problem-space, not a product. Examples include:
- Sleep
- Posture
- Skin texture
- Travel safety
- Pet anxiety
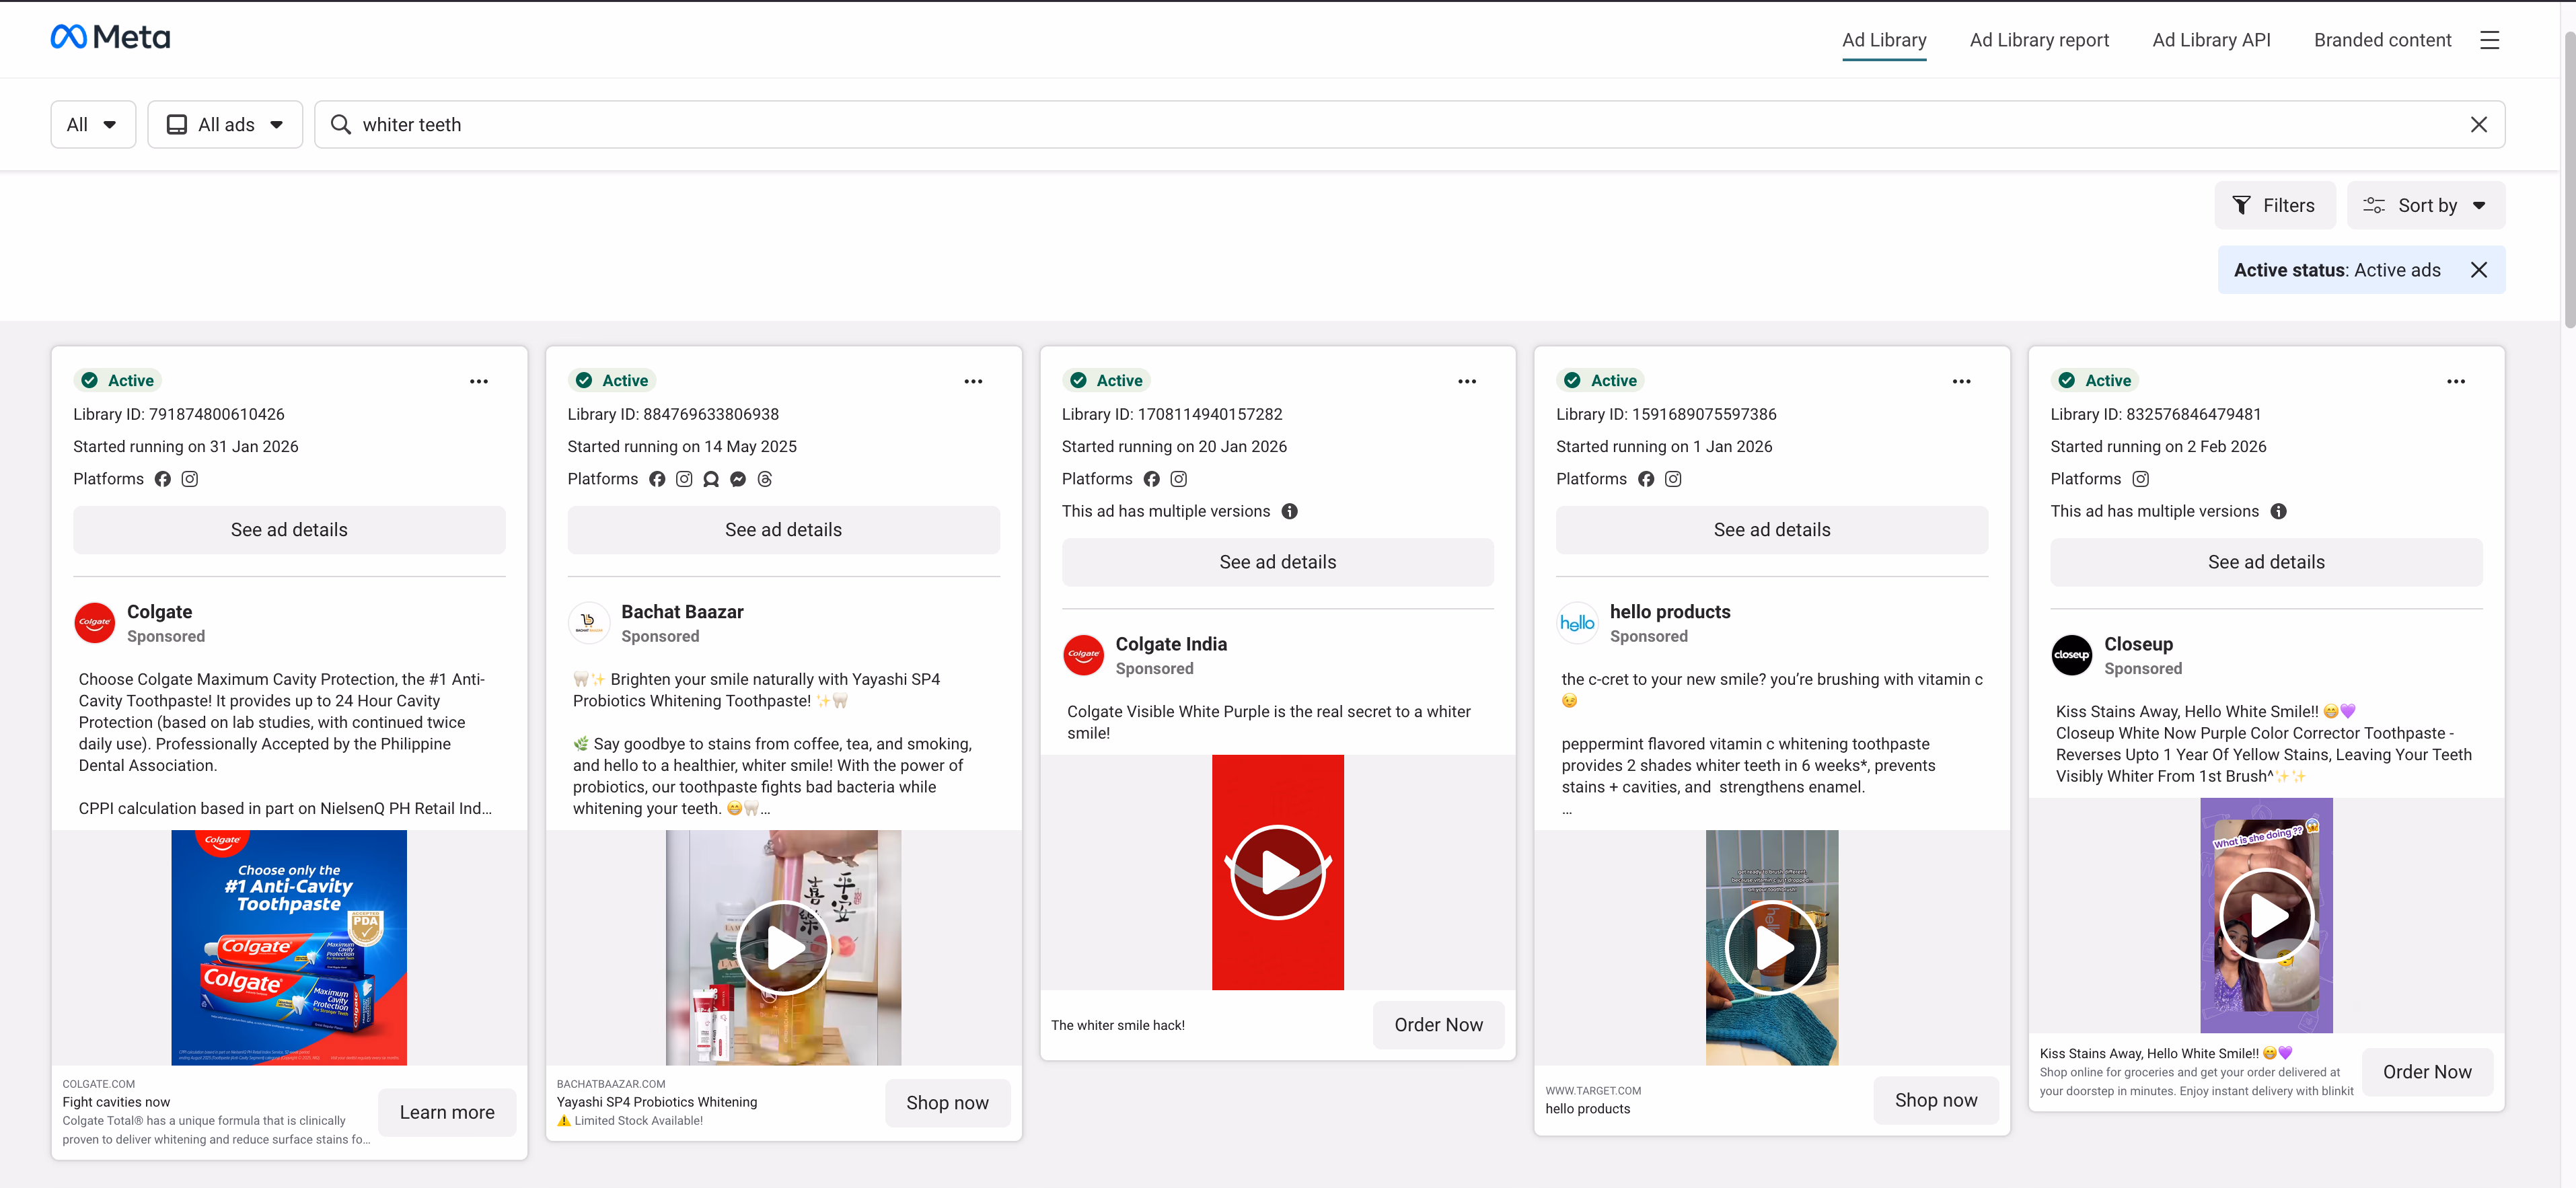
Run 3–5 keyword searches that buyers or advertisers would use. Mix these categories:
- Problem keywords (the “why”): neck pain, snoring, frizzy hair
- Solution keywords (the “what”): pillow, serum, hair towel
- Outcome keywords (the “result”): whiter teeth, glow, flat belly
Limit your search by selecting the region you sell in. Don’t search globally by default. This prevents mismatched trends caused by geography.

At this stage, you’re not looking for a single ad. You want to find clusters of:
- Multiple pages advertising similar products
- Repeating promises with the same “before/after” story
- Similar creative formats like UGC, demos, and comparisons
- Similar offer structures such as bundle language or trial framing
Add screenshots as you go. These become the backbone of your creative briefings later. Once you spot a cluster, the next step is to find out who is behind it, not just saving the ad.
Spot winning ads
Meta Ad Library won’t show profits directly, but it provides useful signals. Treat your research like a detective building a case. Here’s a lightweight scoreboard for spotting winners:
- Ad running for a long time: The advertiser isn’t wasting money. Consider the angle worth modeling.
- Many similar creative versions: They are iterating on a converting formula. Extract what stays the same (hook, structure) rather than what changes (actors, backgrounds). Studying the best ad creatives can reveal these winning patterns.
- Clear creative families: They found a repeatable format, which your team can reproduce faster than starting from scratch.
- Consistent messaging across ads: Shows strong positioning. Build your landing page and offer around that message, not random features.
Engagement metrics like likes and comments alone don’t prove success. Engagement can signal controversy as much as conversion.
Use comments strategically to spot:
- Questions about “does this work?” indicating a trust gap
- Queries like “will it fit me?” showing a specification gap
- Statements like “I need this” revealing high purchase intent
- Comparisons to alternatives, revealing the competitive set
If an ad runs long, has many variations, and comments show clear intent, it signals a structured, winning campaign.
Once you identify a probable winner, convert observations into internal tests quickly.
Turn ad observations into product hypotheses
Every competitor ad condenses a strategy. Extract four key elements:
- Offer: What makes it easy for customers to say “yes”?
Look for repeated messages:
- Use of bundles versus single units
- “Limited” vs evergreen framing
- Emphasis on guarantees, shipping, or results
If most ads repeat the same bundle wording, the market signals which offer type works.
- Hook: What grabs attention in the first 2 seconds?
Categorize hooks from competitor ads, such as:
- Calling out the problem
- Showing the result first
- Demonstrating the mechanism
- Busting myths or causing contrast
- Sharing social proof stories
If one hook type recurs across brands, treat it as a category-level trend.
- Landing page cues: Where does the ad lead and what does it promise?
Click through to identify patterns:
- Product page versus advertorial style
- Does the page’s top match the ad claim word-for-word?
- Is the above-the-fold section focused on result, proof, or specs?
Winning ads usually send visitors to pages that continue the ad’s message, not generic brand stories.
Want to automate this competitive analysis across hundreds of ads at scale? The Trendtrack Chrome extension lets you capture and organize competitor offers, hooks, and landing page patterns in seconds.
- Pricing cues: What price range is the market training buyers to accept?
You’re mapping the acceptable price zone. For instance, if all competitors lead with bundles, a single-unit price might appear cheap or expensive depending on framing. Combine everything into one testable hypothesis paragraph:
Product hypothesis: “This niche scales [product type] framed as [primary outcome], using [hook family], pushing [bundle or guarantee], and landing on [page style]. We can enter by [differentiation like clearer proof, tighter specs, stronger creative], while staying within the market’s pricing zone.”
Use Trendtrack as a better ad library alternative
Starting from individual products on Facebook leads to overwhelming noise. Instead, begin with stores already gaining traction and work backward to see which products they promote heavily. In Trendtrack, open Shops. The table shows crucial fields for quick evaluation:

- Best-selling products
- Monthly visits
- Category
- Market
- Number of live ads
Filter for stores that are “proven but not famous yet”:
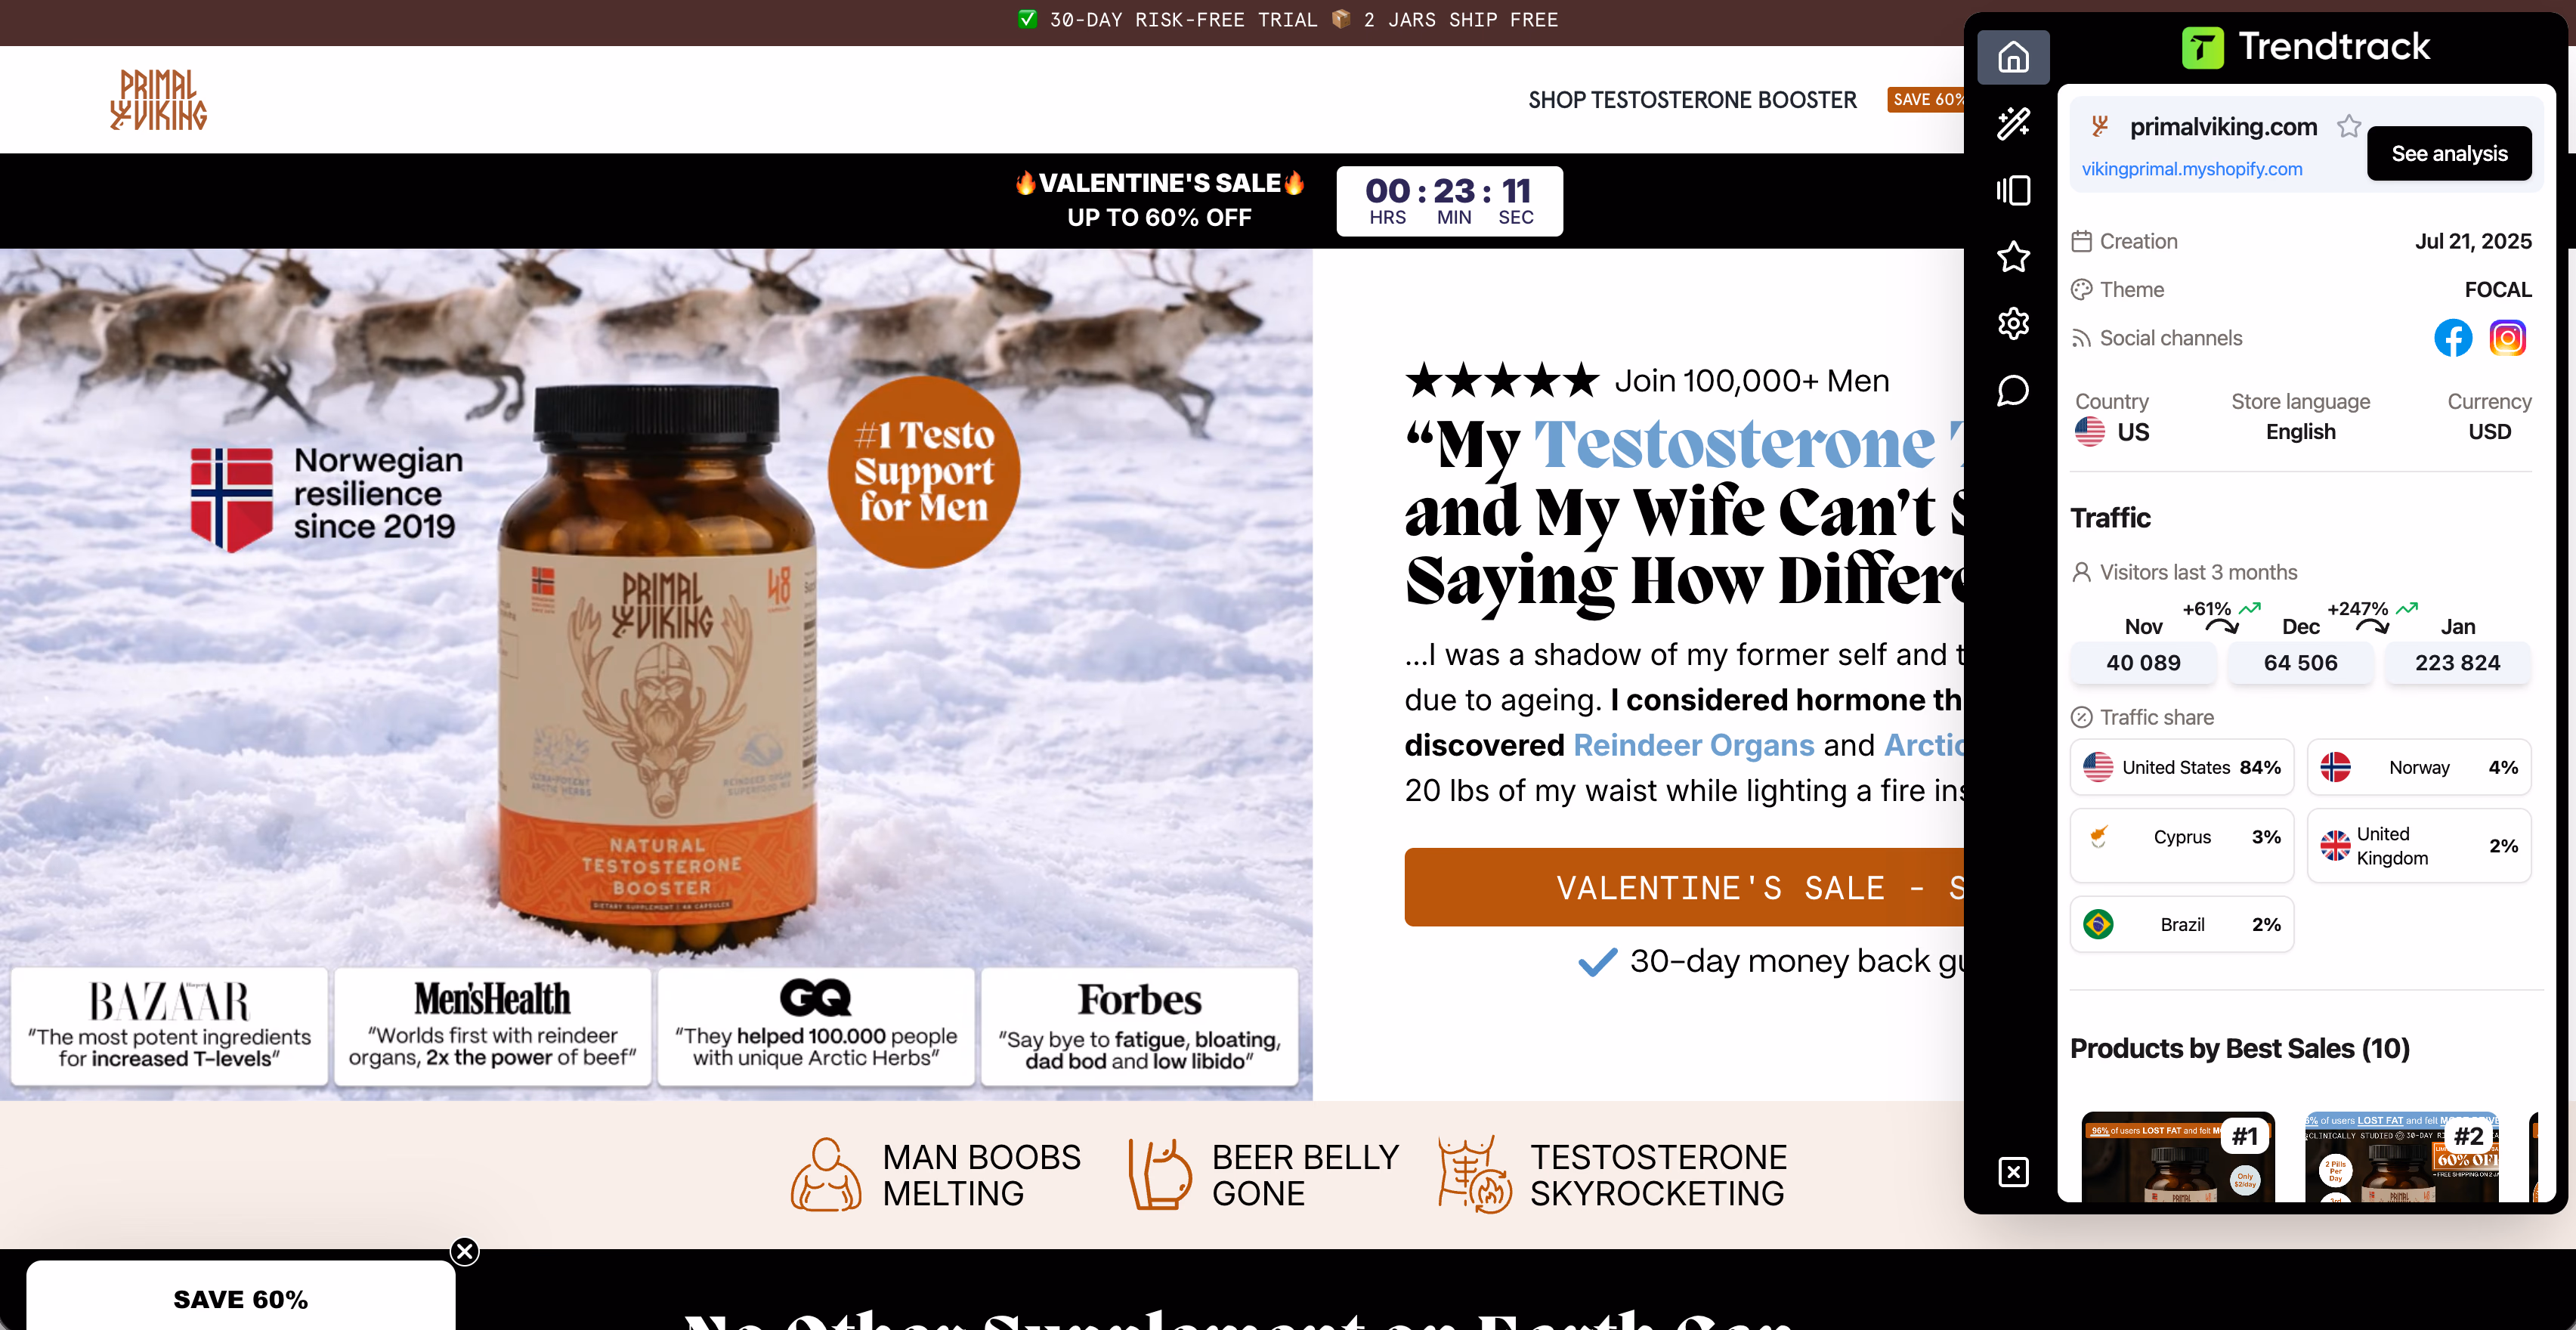
- Look for a steep growth curve over the past 30–90 days using Trendtrack’s traffic growth filters.
- Focus on stores with 10,000–100,000 monthly visits. This is a range indicating a working product but not a mega-brand with unlimited budget.
- Open each store and scan their best-selling products; usually only a few SKUs drive most sales.
This method lets you tap into the market’s current curriculum, avoiding endless guessing.

Use built-in snippets like Top Scaling or Shop’s Ad Peak to quickly identify stores accelerating. Then narrow down using performance filters such as traffic and ads count.
Use store traffic trends (30–90 days) for real demand
Without a relevant time window, trending means little. Trendtrack allows you to monitor traffic over 30–90 days while comparing it to ad activity. This combination helps distinguish a one-week spike from sustainable growth.
Interpret traffic and ads trends like this:
- Rising traffic + rising ads activity: The store is likely scaling successful products, not just riding a viral wave. Understanding what's a good ROAS for Facebook ads helps you benchmark their success.
- Flat or declining traffic + rising ads activity: Could indicate creative fatigue, offer problems, or a crowded market.
- Rising traffic + flat ads activity: May be organic growth, investigate further and seek ad proof before modeling.
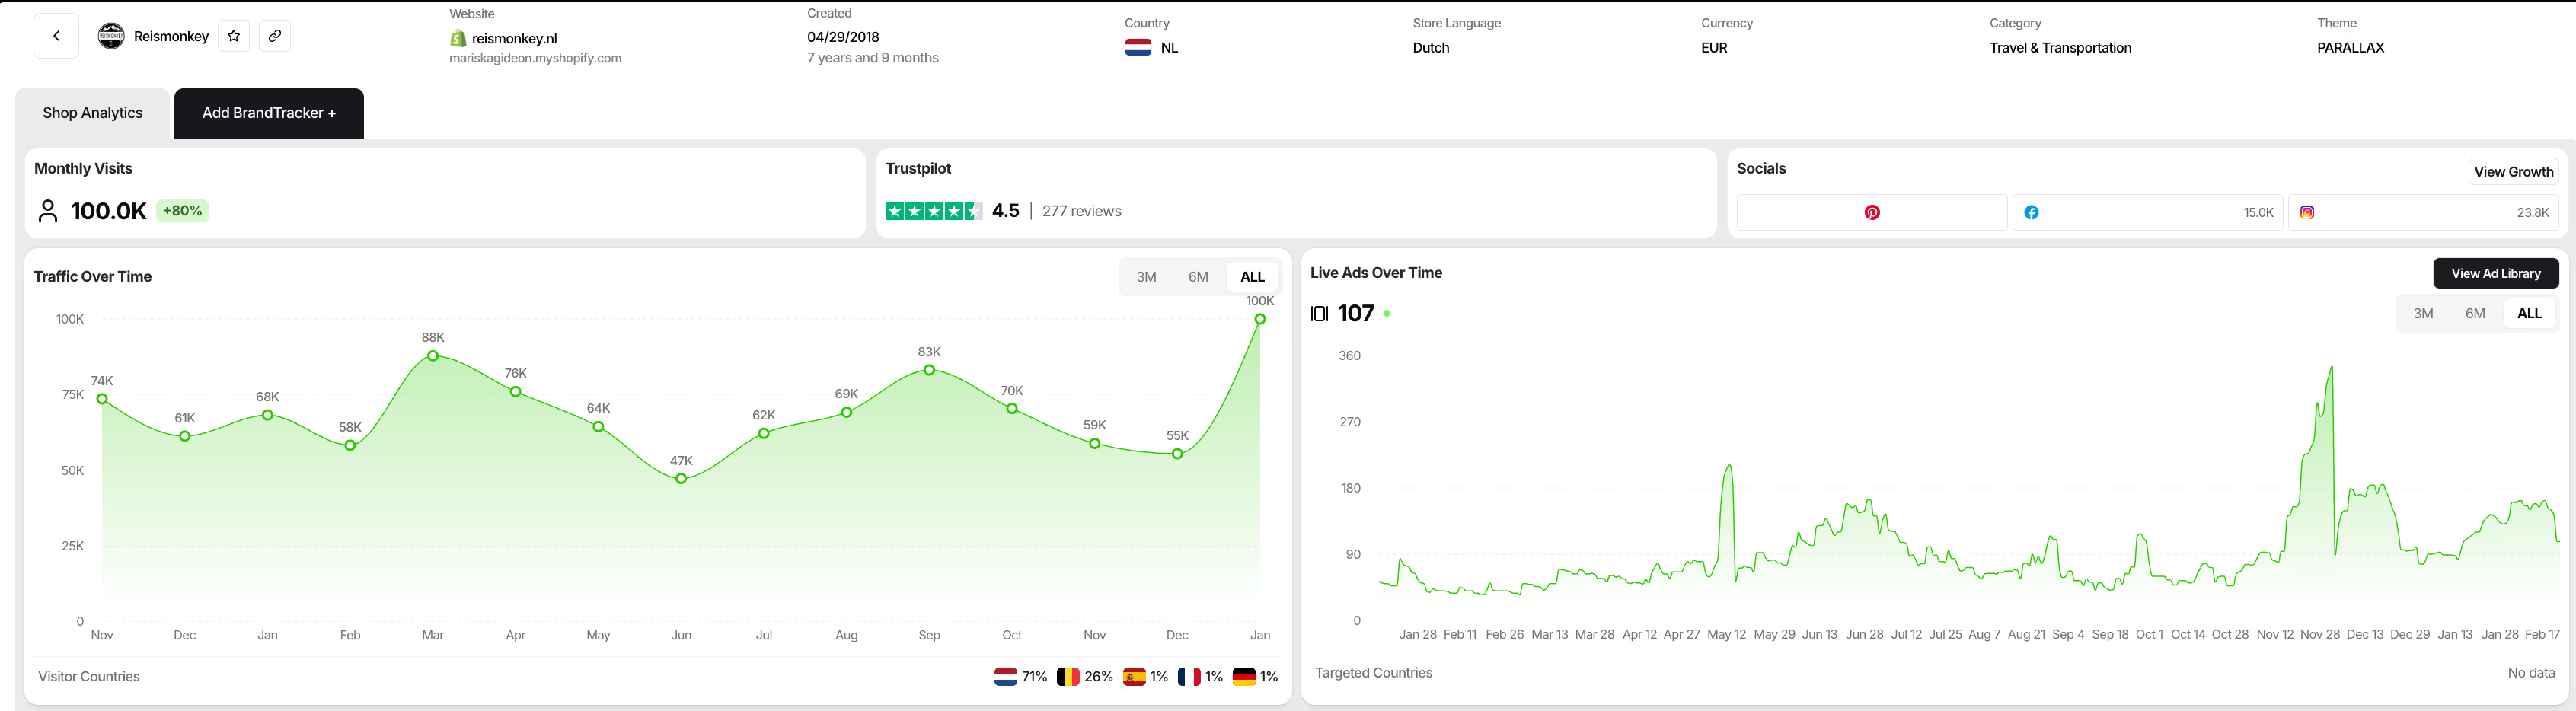
Trendtrack’s strength is using store-level traffic data instead of relying solely on engagement metrics to assess demand.
{{cta-2}}
Track ads data across brands
After identifying 5–10 interesting stores, switch your focus from what product is hot to what products brands keep investing in. Trendtrack offers three key tools:
- Ads for broad scanning
- Brandtracker for deep dives on competitors
- Chrome extension for quick checks while browsing stores
Use Trending ads to spot patterns fast:
- Filter ads running for at least 30 days to find long-lasting, likely profitable ads.
- Look for duplicates, since repeated ad concepts imply success.
- Use format (images/videos) and category filters to compare similar creatives.
- Monitor Facebook Page signals like creation date, followers, and recent spend to catch budget changes.
In Brandtracker, dig deeper:
- Check active ad count. Running 200+ ads means serious testing at scale.
- Sort creatives by longest running or most duplicated. If a product has 10+ duplicate ad variations over 90 days, it’s a strong signal of success.
- Use One-Click Download to grab media quickly for testing without rebuilding assets.
- Analyze ad copies and headlines by usage and longevity to find winning messages.
- Preview landing pages and connect them to ads to study the full conversion path. Prioritize pages receiving most of the ad traffic (often 80%+) for insight into effective funnels.
Cross-validate with Google Trends
Trendtrack shows what stores and ads are doing, but you must decide if the market is ripe or crowded. Use these checks:
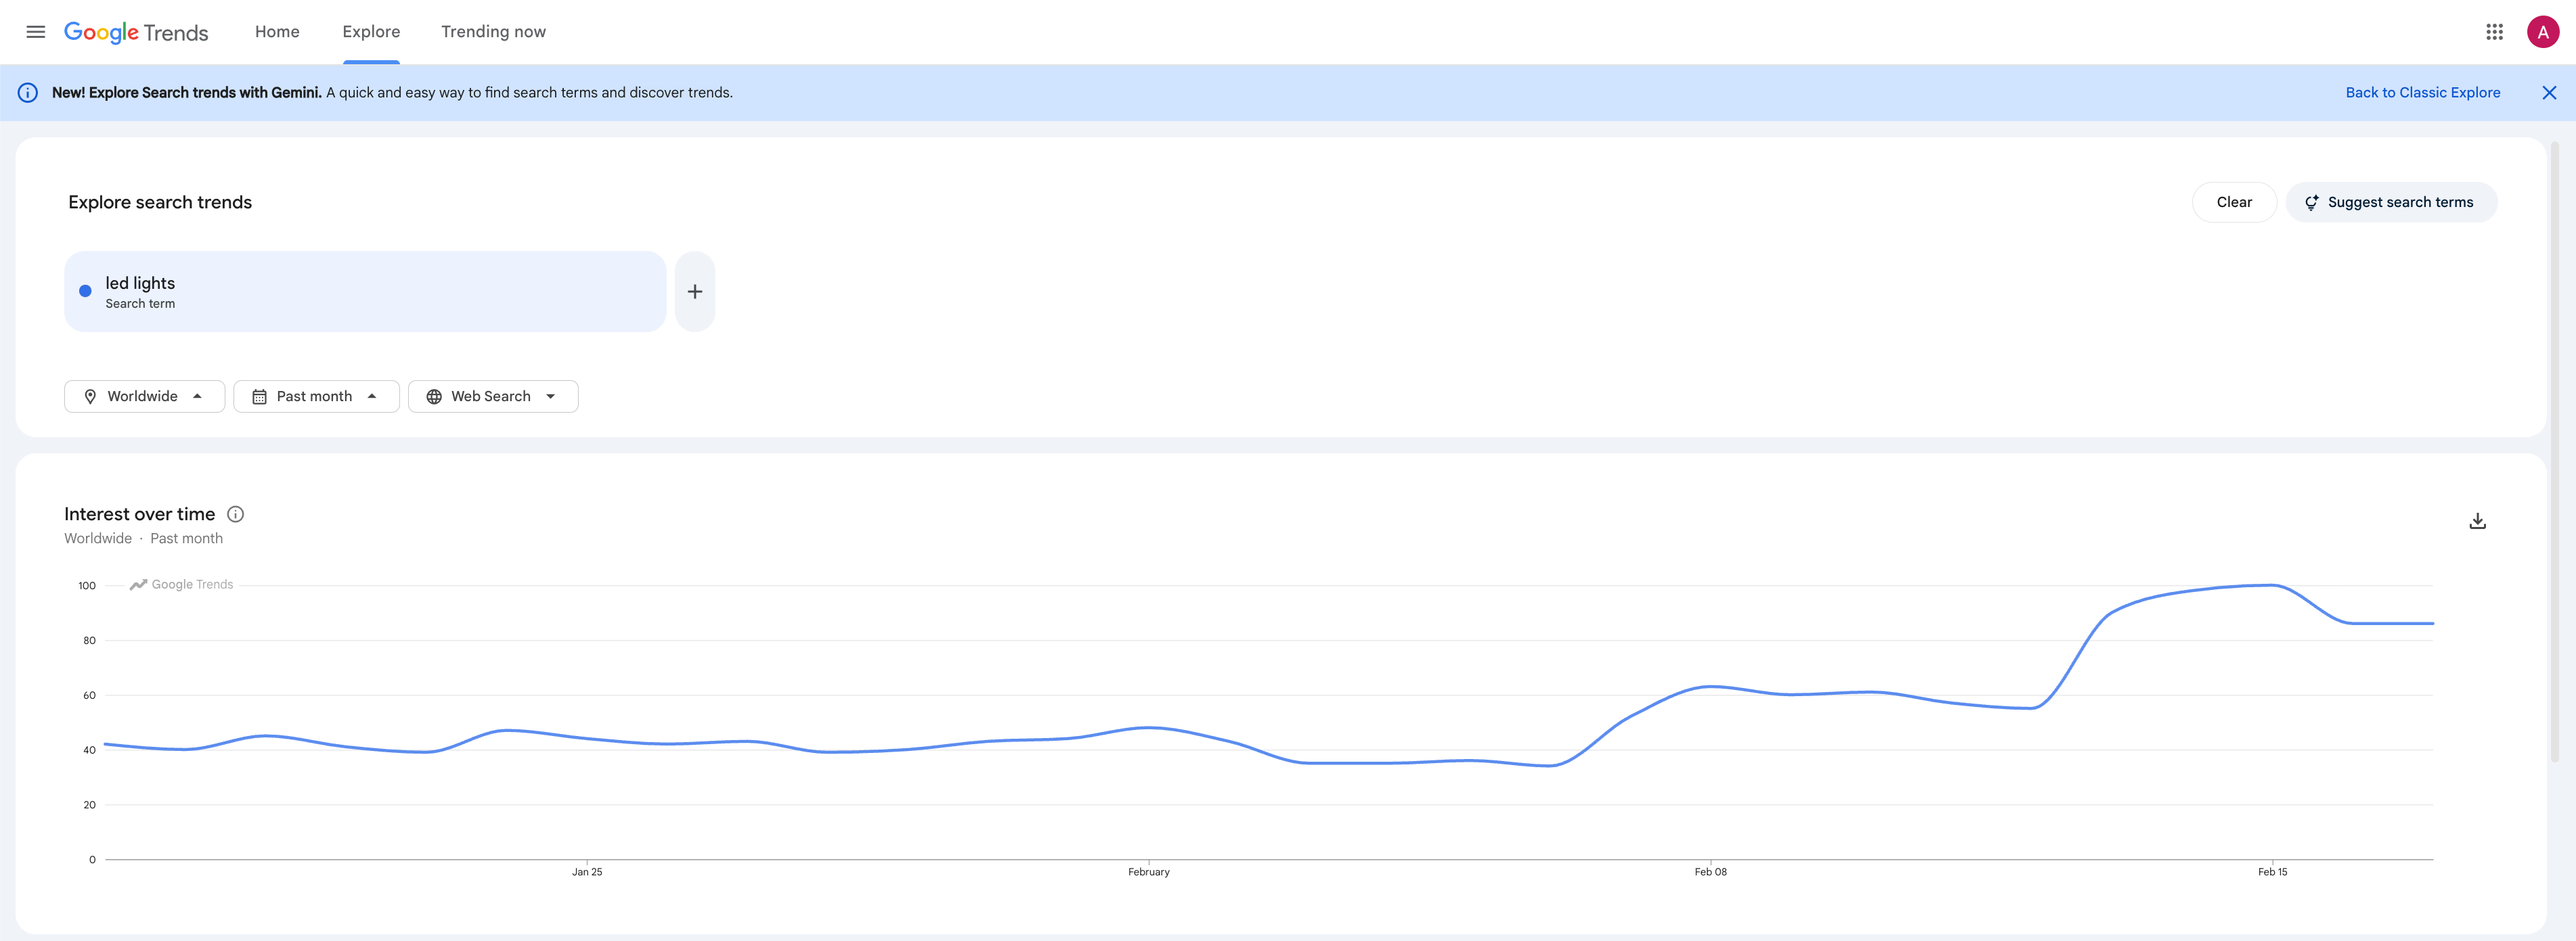
- Google Trends for durability
- Seek steady or rising interest over 3–6 months, avoiding sudden spikes that fade.
- Flat or declining interest over six months signals caution, while rising trends indicate stronger demand.
- Competitor counts for saturation
- Under 20 major competitors advertising a product suggests the market remains viable.
- Fewer than 10 stores actively scaling ads marks the early sweet spot.
- More than 50 competitors usually means high competition, pressures on CPM, and fatigued creatives.
{{cta-1}}
Conclusion
Finding trending products on Facebook comes down to reading the right signals. Use engagement patterns and ad longevity to spot proven winners. Then validate with store traffic data and Google Trends to confirm real demand.
Meta Ad Library gets you started. Trendtrack speeds up the process by revealing which stores are actually scaling.
Always check unit economics before committing. A viral product means nothing if the numbers don't work. Start with stores showing momentum, work backward to their hero products, and let data guide your decisions instead of guesswork.


.avif)
Ready to build a millions dollars brand ?
.avif)
