Dropshipping Product Trends 2026 to Watch Now


You're scrolling TikTok and saving dozens of screenshots. Then you cross-check Meta Ad Library at midnight. If this is how you find winners in 2026, you're consuming content, not researching products.
The global dropshipping market reached $351.8 billion in 2024. It is projected to exceed $500 billion by 2026, expanding at nearly 24% annual growth. This explosive expansion creates more opportunities—but also intensifies competition and eliminates room for guesswork.
Ask the right questions to sharpen your product selection:
- Which Shopify stores are gaining traffic now?
- Which offers face sustained ad pressure, not just short spikes?
- Which products can survive scaling in terms of variants, shipping, returns, and compliance?
Treat product selection like performance marketing by focusing on signals, thresholds, and fast iteration.
Identifying winning dropshipping products
You have to find trending dropshipping products without losing margins to shipping, stockouts, listing errors, or compliance issues. Evaluate products through four lenses:
- Demand metrics
- Margin versus shipping complexity
- Supplier readiness
- Automation & forecasting
Demand metrics
High-potential products show consistent demand across multiple sources, not temporary trend-driven bursts. Look for strong search volume, sustained growth rates, and clear seasonal patterns.
Identify stable revenue opportunities, not just what's popular today. Track competitor performance through store-level metrics like monthly visits and traffic growth.
Margin versus shipping complexity
Many "high-margin" products lose profitability once you factor in dimensional weight, packaging, damage, and returns. Compare shipping costs, packaging needs, returns handling, fulfillment options, and profit stability.
Low-complexity products handle broader targeting and faster testing. High-complexity products require tighter positioning to avoid surprises.
Supplier readiness
Verify operational readiness, not just promises. Check that suppliers provide:
- Structured data feeds
- Catalog stability
- Accurate fulfillment capacity
- Scalability
- Regulatory compliance
- Predictable replenishment
Skipping these checks means you'll win ads without the ability to fulfill orders.
Automation and forecasting
As catalogs grow, operational accuracy becomes critical. Automation syncs data and prevents mismatches. It identifies seasonal patterns through demand forecasting. It also protects margins via repricing and cost monitoring. This separates repeatable winners from short-term tests.
Fashion as a core pillar of dropshipping
Fashion remains a major dropshipping category in 2026. It evolves constantly, with new fits, fabrics, and aesthetics transforming basics into must-haves. This category thrives due to:

- Steady customer demand
- Quick design cycles
- Large supplier pools
Globally, the apparel and footwear market is valued at $1.7 trillion and is expected to reach nearly $2 trillion by 2028. For 2026, this means more brands, more ads, and more imitators. Your advantage won't be finding a product. It will be spotting shifts earlier and validating demand quickly.
Criteria for identifying winning fashion products
Predicting fashion winners means scaling operations while creative competition rises. Use these filters to evaluate products:
Use these filters to evaluate products:
- Consistent demand signals over time (not brief spikes)
- Margins that survive logistics costs
- Supplier readiness with clean product data and stable catalogs
- Automation-friendly feeds for variant syncing
Fashion scales successfully when creative speed and operations run smoothly together.
Product examples
Focus on apparel items with manageable shipping and returns. Prioritize:
If you want a broader list of repeat-buy items you can test quickly (without heavy shipping complexity), here are some consumable product ideas to pull from before you build your next micro-aisle.
Choose one main category like shirts, then add one complementary item like beanies. This focused approach helps your store and ad account learn faster. Avoid testing too many categories simultaneously.
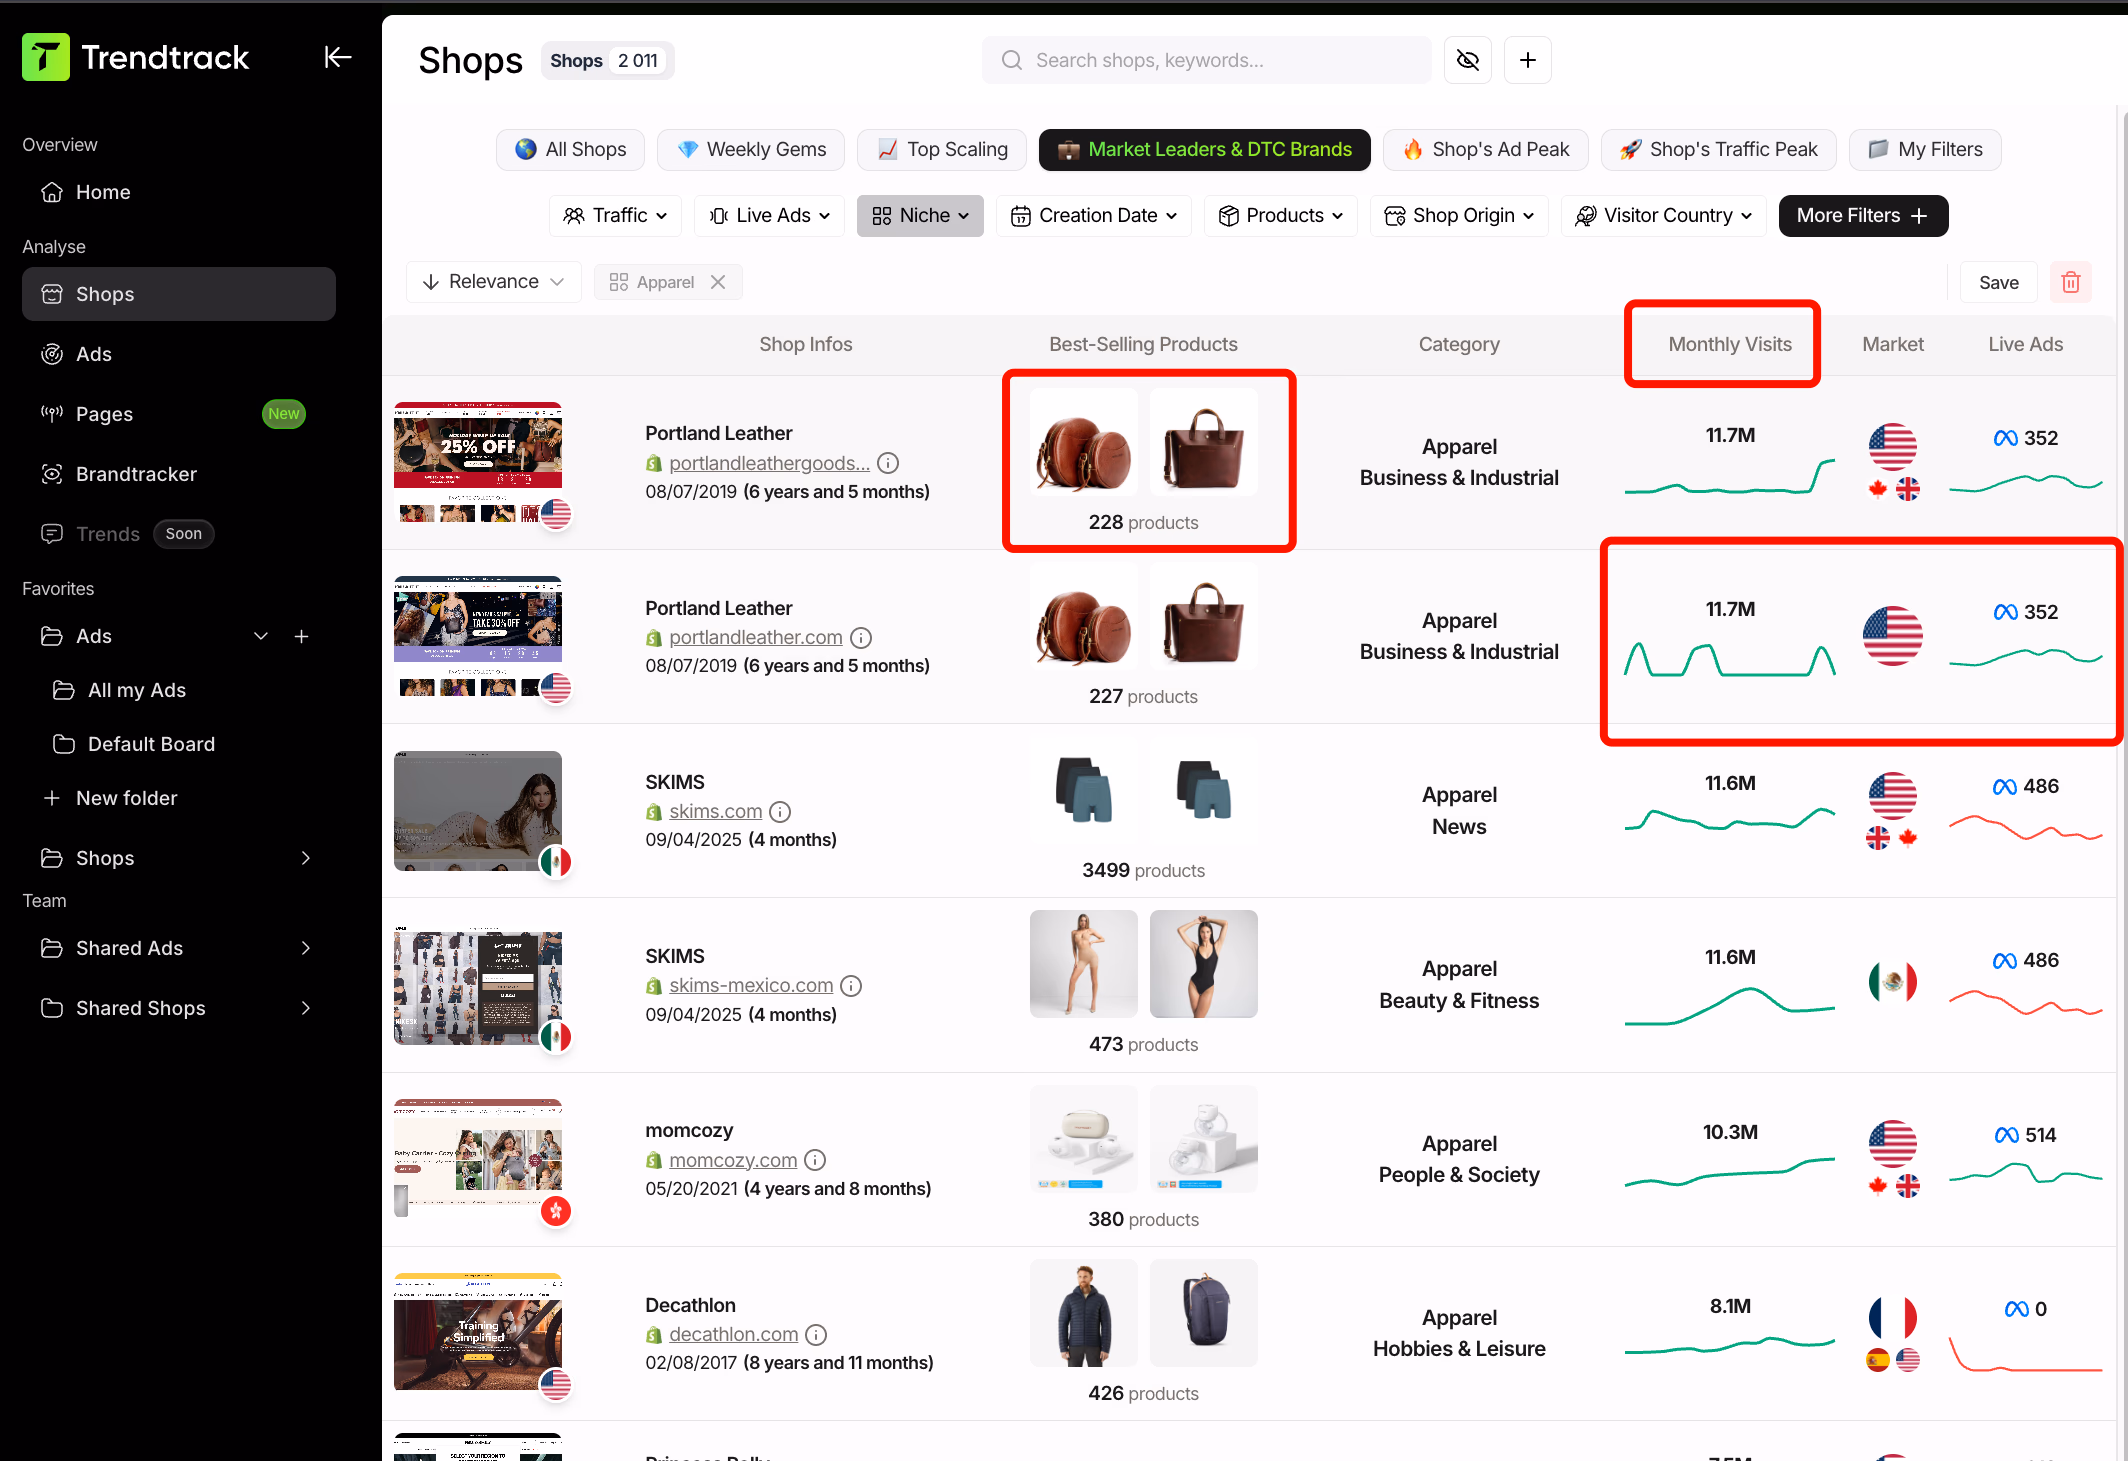
How to spot with Trendtrack
Use a repeatable method that links store traffic, ads data, and viral tracking to stay ahead:
- Start with Shops. Track best-selling products, monthly visits, categories, and live ad counts. Filter for traffic and ads growth to catch accelerating trends.
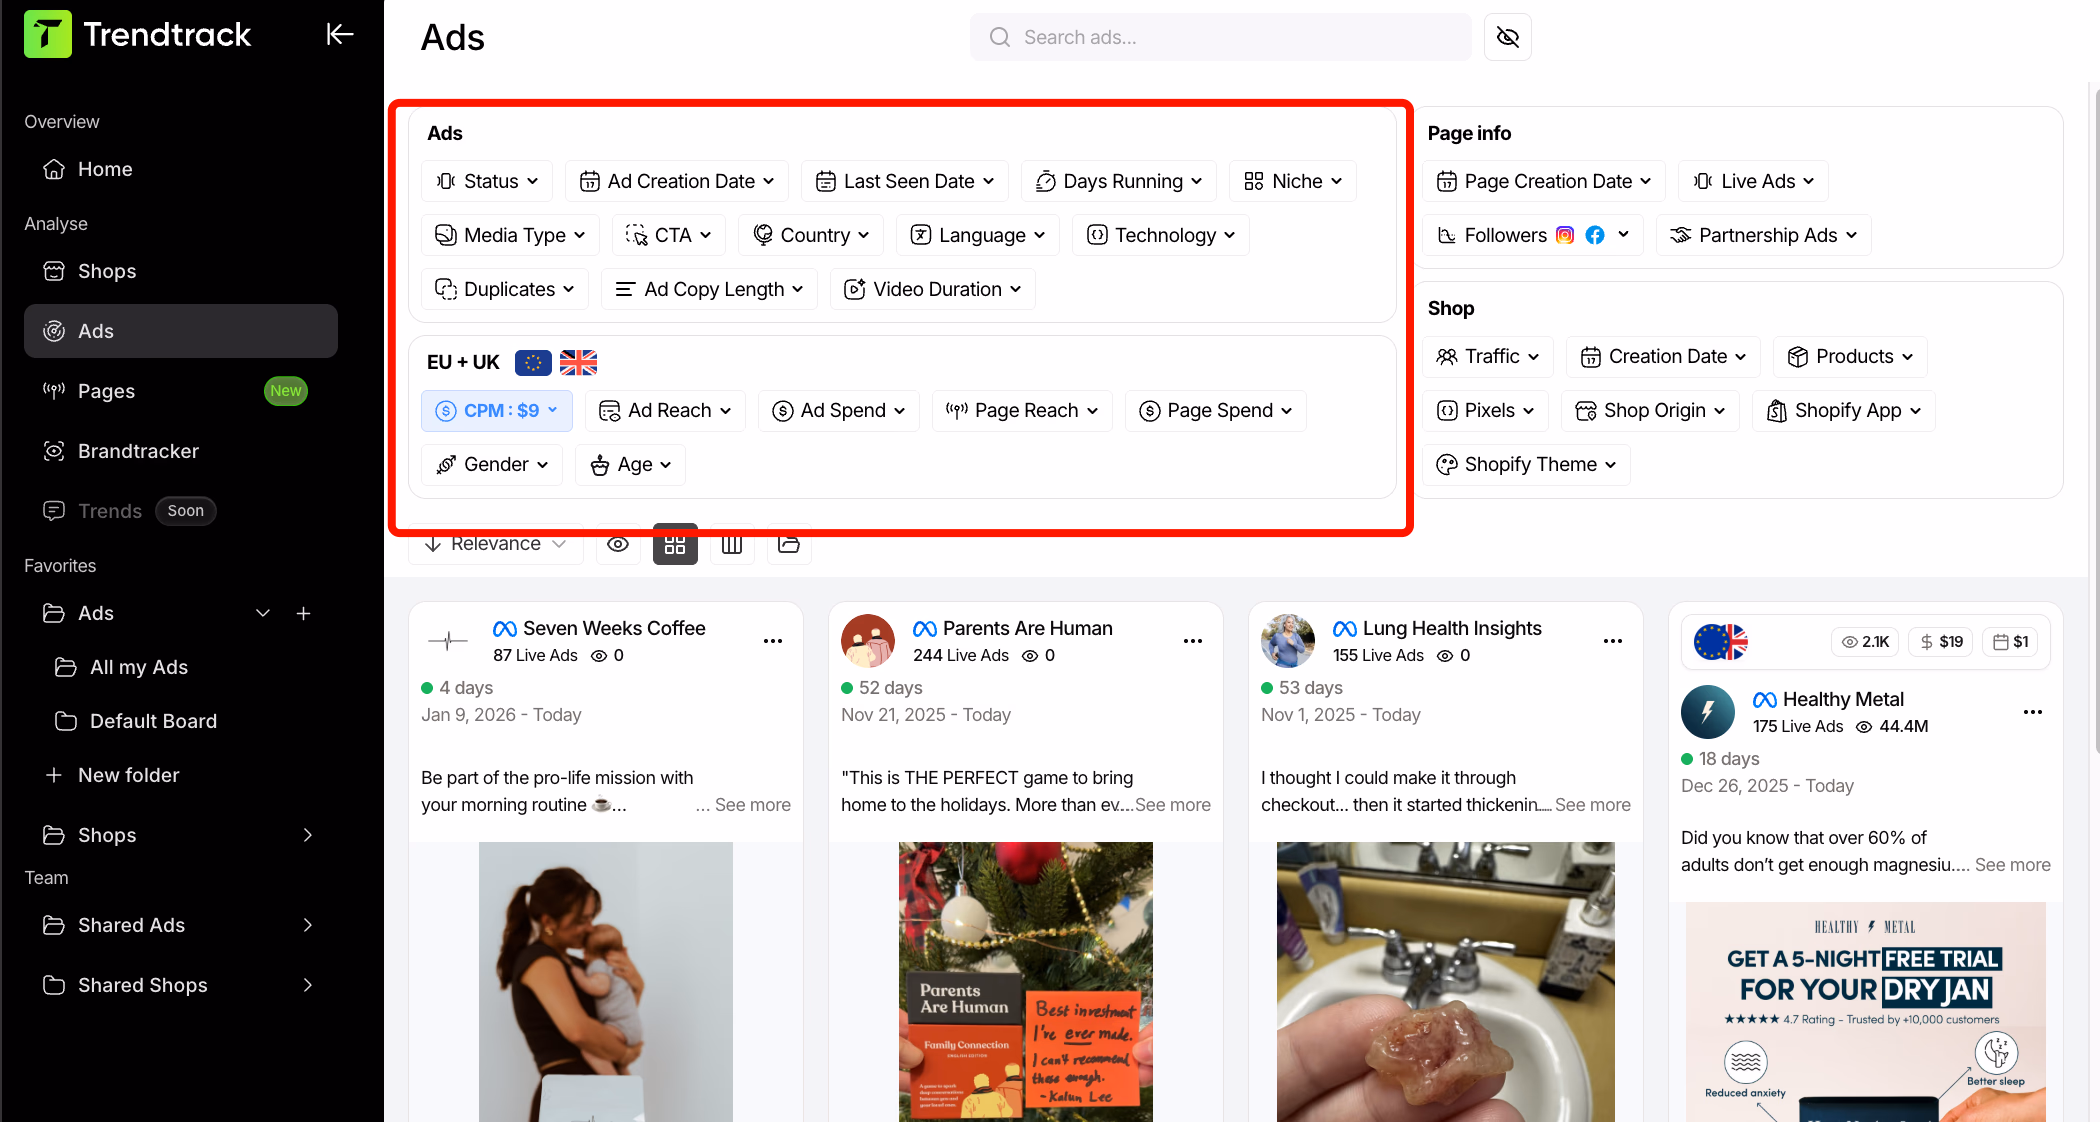
- Check ads. Focus on proof of intent by filtering for ads running multiple days, duplicates, format, and category. In the EU and UK version, filter ads by actual spend and reach to find well-funded campaigns.
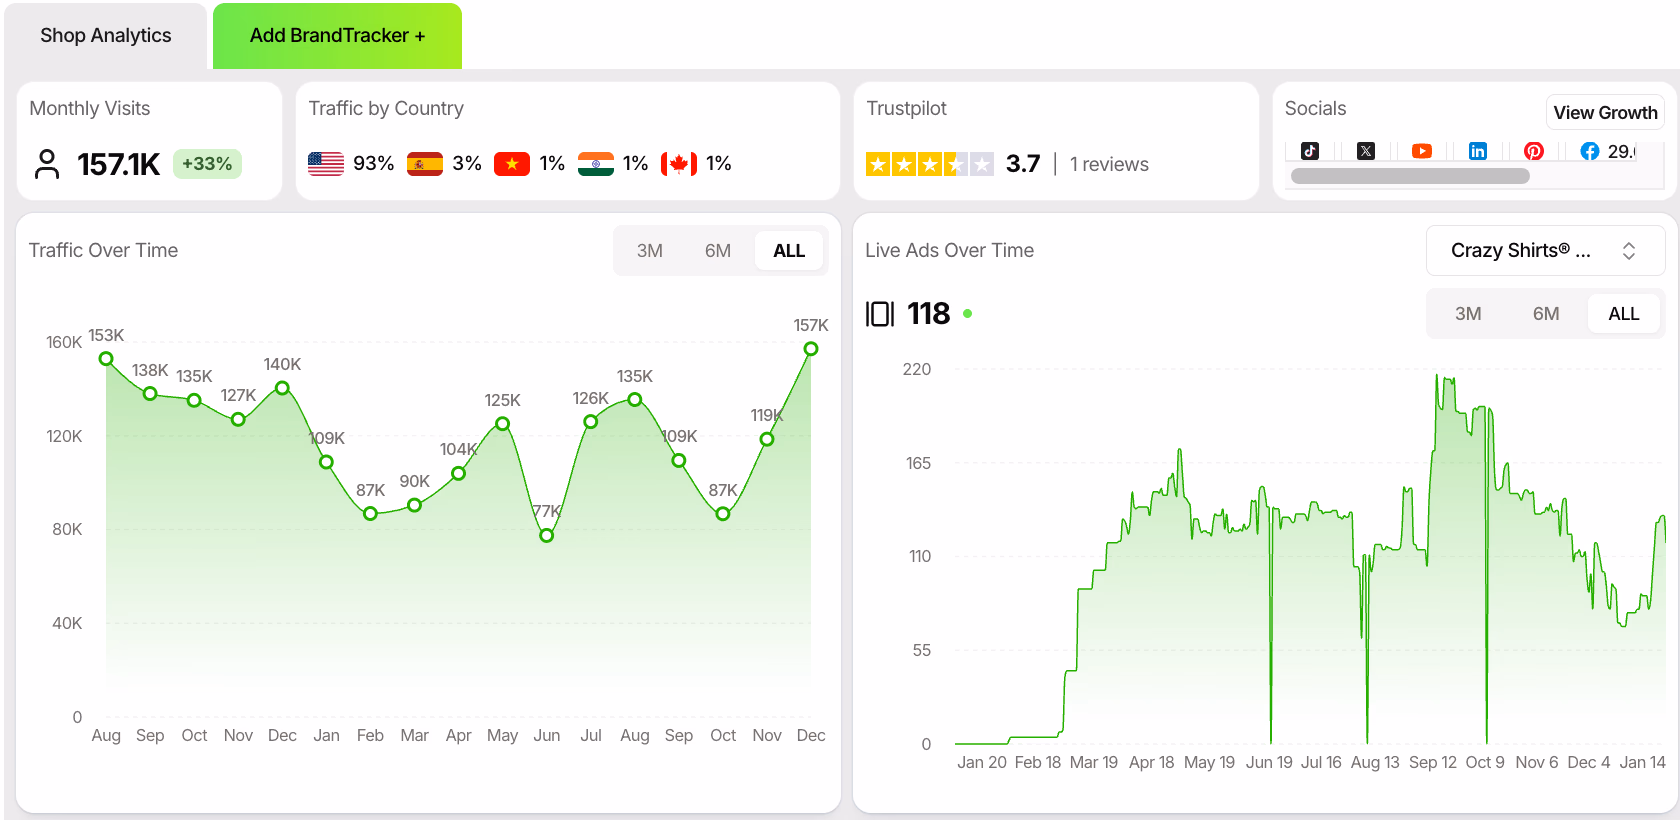
- Use Brandtracker to add competitors and avoid time-consuming scrolling. View their daily tests. Pull creatives into a sortable feed. Review ad copy and headlines as structured data. Preview landing pages. Video transcripts speed up briefing sessions.
Before scaling creative or spend, confirm these signals. Rising store traffic, repeated ad behavior, and continuous spend with creative repetition.
Ready to validate high-ticket opportunities before investing? Learn how to analyze high-ticket dropshipping products using the same data-driven approach across different price points.
Profitability checks for dropshipping apparel
Returns erode margins quickly. Before scaling, verify:
- Price point ($50–$200): Lower prices need high volume; higher prices increase support costs. Start with lower-risk products before moving to premium items.
- Margin versus complexity: High margins disappear with complexity. Factor in shipping weight, packaging, damage risk, return rates, and seasonal stability.
High-margin, low-complexity items like hats work best. Coats offer margins but higher complexity; sneakers risk returns from sizing issues.
Never scale a fashion SKU until sizing, materials, and variants match expectations. Study what top DTC brands scale, retain, or drop rather than copying products directly.
Health, beauty and wellness products
Health and beauty products follow the "small package, big intent" principle. Buyers don't browse randomly—they seek specific solutions:

- Acne treatments
- Scalp remedies
- Split end fixes
- Sleep aids
- Energy boosters
This targeted approach makes the category a consistent high-margin opportunity.
The beauty and personal care market will exceed $650 billion in 2030. Growing demand for vegan, organic, natural, and eco-friendly products drives this growth. Two standout categories emerge:
Natural skin care expands at 6.3% annually. Targeted hair care solutions address split ends, hair loss, dandruff, and itchy scalps.
Product examples to test in 2026
Don't treat beauty as a single category. Combine fast-testing demos, staples, and premium items with strong positioning.
Key micro-niches include:
Beauty and skincare videos perform strongly on TikTok. Routine-style or product-first demos validate ideas without guessing.
How to spot trends early with Trendtrack
Most teams fail because they lack validation, not ideas. Do not spend hours scrolling through ad libraries and spreadsheets. Create a systematic approach that connects store traffic, ads, and viral signals.
Watch for these signals:
- Traffic spikes that align with focused landing pages. A clear lift tied to a single-product, single-promise page signals strong interest.
- Repeated ad hooks across creators. Look for consistent claims delivered by different creators or formats, not just a high ad count.

- The beauty angle ladder. Brands climb through problem, mechanism, routine, and proof as they grow.
- Viral demo cues that drive engagement. Products showing clear before/after effects or visible interactions often drive views and purchases.
Trendtrack combines store analytics, ad data, and viral tracking to help you validate angles before investing heavily. Launch campaigns with confidence using real-time insights.
{{cta-1}}
Profitability checks: balancing margins, shipping, and returns
Beauty products deliver strong profit margins but expose you to risks through compliance issues, breakage, and returns. Verify these factors before scaling:
- Margins: Expect 10-40% typical range. Factor in reshipping costs and damage losses.
- Price range: $50-$200 maximizes revenue potential.
- Shipping: Fragile items demand careful packaging to prevent damage.
- Returns risk: Texture and scent mismatches drive refunds.
- Regulations: Supplements require certificates of analysis, dosage labels, and batch numbers.
Focus on products with compelling stories and straightforward operations to minimize complexity and maximize success.
Home and living goods
Home and living performs consistently because it relates to daily routines, not short-lived trends. People regularly update their spaces, creating steady demand across many sub-niches.

Spending on home interiors, décor, and furnishings to reach $949 billion by 2032. Search interest usually peaks in January and July, making these key times to launch products.
Product examples to test in 2026
Focus on products that are easy to explain in one sentence. They should display well in video content and avoid shipping issues that hurt profit margins.
Consider these home and lifestyle categories:
Avoid pitching generic home décor. Instead, target specific customer needs like home décor for small apartments, neutral palettes or dorm rooms. This targeted approach sets your brand apart and attracts buyers searching for solutions, not just products.
How to spot winning products early with Trendtrack
Use a simple process to confirm trends before investing:
- Start by analyzing store traffic to distinguish real demand from hype. Look for steady growth, especially around January and July.

- Examine ads for repeated product angles across different creatives. Multiple ads featuring the same rug or steamer indicate higher conversion potential. Look for bundles and “room set” presentations that enhance perceived value.
- Watch viral content formats rather than just viral products. Winning home items follow specific formats.
- Satisfying organization clips
- Before-and-after lighting changes
- Renter-friendly solutions
Trendtrack reveals which stores gain traffic and which product angles perform best. Use this data to create tests based on proven market success instead of guessing. This proactive approach keeps you ahead of competitors.
Profitability checks before scaling home and living products
Home and living offers high margins by focusing on lightweight, non-fragile items in the $50–$200 price range. This minimizes pre-sale support and shipping costs while keeping mistakes manageable.
Key priorities:
- Minimize returns through accurate product descriptions and photos that match actual color and texture
- Choose fulfillment-friendly SKUs like pillowcases, hangers, and liners
- Build margins through upsells and bundles rather than single large items
- Aim for 30–40% margins by avoiding bulky products and streamlining logistics
Success in home and living requires consistent demand, clear marketing, and smooth operations. Validate ideas with data and copy proven signals from other brands.
Before scaling kitchen products with paid ads, understand what return on ad spend (ROAS) you should actually target—learn what a good ROAS looks like for Facebook ads so you can set realistic profitability benchmarks.
Kitchen and dining
Kitchen and dining products aren't flashy, but disciplined sellers continue to profit here. Search interest has grown steadily as more people stay home, and the market is substantial. The global market for kitchen tools was over $31 billion in 2024, growing about 4% year over year.
The 2026 focus is convenience. Items that save time, reduce mess, simplify meal prep, or make hydration, coffee, and protein routines part of daily identity. You're not just selling "a scale". You're selling "I can hit my macros without thinking."
Criteria for identifying winning kitchen products
Winning kitchen and dining products share these traits. Verify them before investing in ads:
- Lightweight and compact design: Keep shipping predictable and margins intact.
- Upsell opportunities: One purchase should naturally lead to the next.
- Optimal pricing: Price products between $50 to $200 to maximize revenue without heavy pre-sale support.
- Realistic margins: Target margins between 10% and 40%. Avoid bulky, fragile, or return-prone items unless they justify their cost.
- Supplier reliability: Partner with suppliers who offer stable catalogs, structured feeds, and automation-friendly syncing to prevent listing issues, price changes, and inventory mismatches.
Validate your ideas carefully to prevent operational chaos.
Product examples to test in 2026
Focus on products that demonstrate well, solve small problems, and maintain healthy margins. Launch a micro-aisle of 3–7 related SKUs to encourage repeat purchases and boost average order value. Top product categories:
Remember: Launch a micro-aisle, not single SKUs, to naturally boost AOV and customer retention.
How to spot trends early with Trendtrack
Kitchen winners appear as patterns, not isolated viral hits. Follow this process:
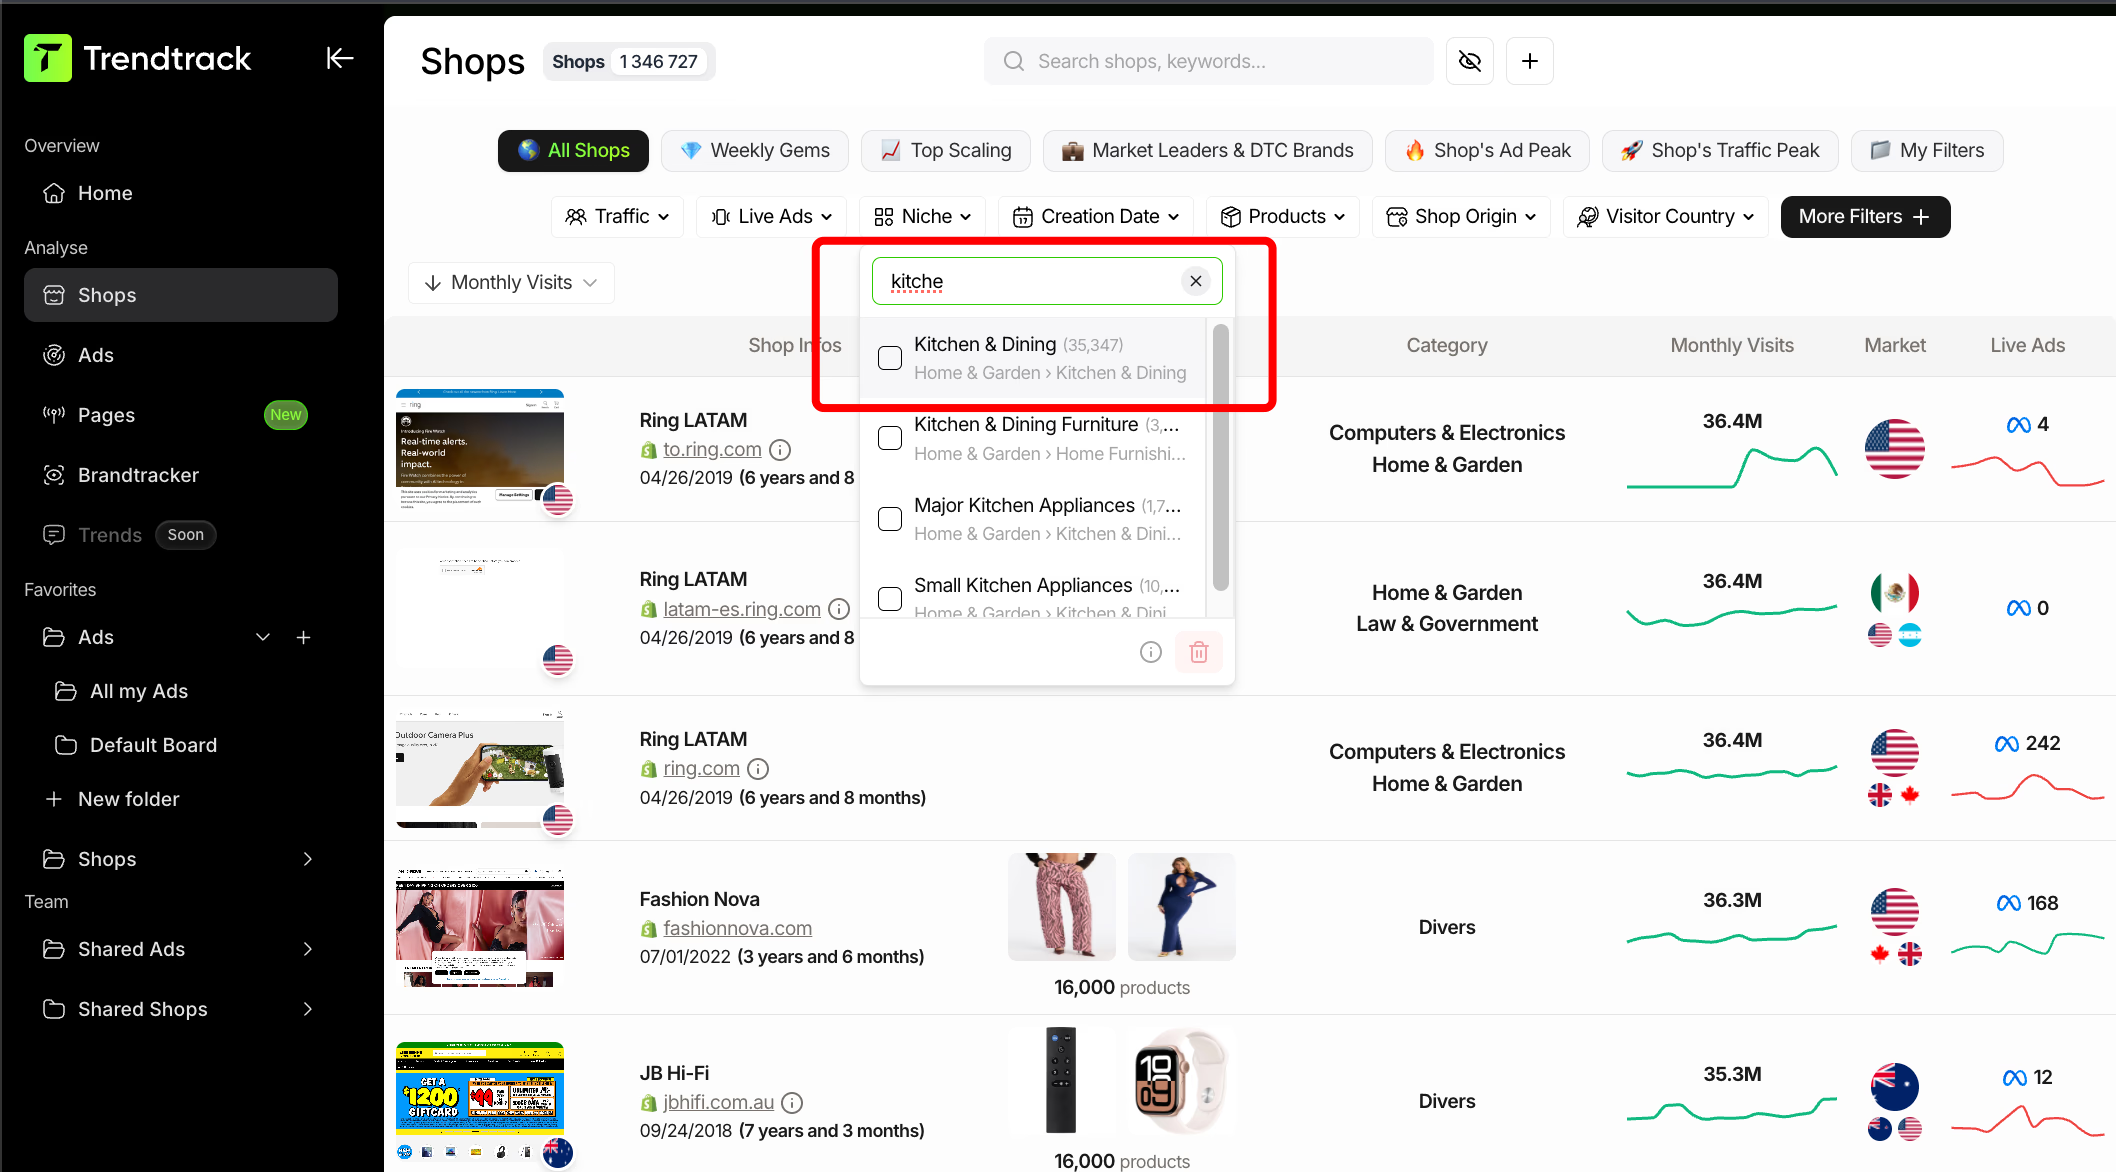
- Store traffic: Look for steady increases over time, not single-day spikes. Multiple stores growing together suggest broader demand, especially around lifestyle cycles.
- Ads data: Repeated ads indicate viable unit economics. Check if products are positioned as time savers, mess reducers, or habit upgrades. Note bundling and demo usage.
- Viral tracking: Viral videos can spark interest but confirm with store traffic and ad spend before scaling. Spend several hours verifying signals.
This workflow lets you outpace competitors and validate ideas with data, not guesses.
{{cta-2}}
Profitability checks: balancing margins, shipping, and returns
Kitchen products appear inexpensive until you factor in bulky, fragile, or electrical items that reduce margins. Key considerations:
- Shipping: compact products maintain better margins
- Packaging and damage: use consistent, rigid supplier packaging
- Returns: accurate descriptions reduce refunds
- Inventory: maintain stock aligned with ad spend
- Appliances: require precise specs and secure packaging
To maximize profit, focus on lightweight staples like tumblers, bottles, lunch boxes, and organizers. Use bundles to increase order value. Spy on competitor ads with Trendtrack and launch your campaign using validated data.
Automotive, car accessories, and sports gear
This is the "practical spend" corner: people buy when something breaks, comfort matters, or their hobby becomes serious.
Automotive parts, car accessories, and sports/outdoor products appear frequently in 2026 demand maps. They solve real problems, follow seasonal cycles, and benefit from suppliers improving catalog syncing and accuracy.
These categories punish sloppy operations. Fitment mistakes, missing specs, bad inventory feeds, and unclear compliance reduce conversions. They also trigger returns and disputes. Successful sellers treat product selection as an operations challenge, not a "cool product" problem.
Product examples to test in 2026
Divide your approach into:
- Accessories (easy to validate and ship)
- Performance parts (require precision)
- Outdoor/cycling gear (seasonal and spec-heavy)
For car accessories, choose items that customers instantly understand the benefit of. Examples include:
These products demo well in short-form content and have straightforward logistics.
For automotive parts, expect higher margins but beware of fitment traps. Aftermarket parts need precise compatibility mapping by make, model, and year.
They also require strict supplier reliability and liability controls such as warranties and recalls. If you cannot map fitment clearly, avoid forcing this category.
Cycling and performance outdoor gear involve spec sensitivity. Good test products include:
Performance buyers spend more, but specs and supplier availability matter. Shipping full bikes is usually unprofitable; focus on parts and upgrades.
Active apparel crosses over with outdoor gear. Moisture-wicking fabrics, compression wear, and technical layers are lighter to ship and simpler to manage than hard parts. However, you still need clear fabric and spec data to reduce returns.
Here is a quick overview of sub-niches, why they work, and their biggest risks:
How to spot trends early with Trendtrack
Avoid wasting time on sporadic screenshots. Use a repeatable process:
- Watch for steady store traffic again across multiple stores rather than one-day spikes.

- Confirm with ads data showing repeated messaging and consistent spending to ensure unit economics work.
- Treat viral moments as alerts. Validate them with traffic and ad behavior before scaling.
Profitability checks: balancing margins, shipping, and returns
These profitable niches require strict oversight to prevent margin leakage. Follow this checklist:
- Compact items protect margins; bulky or fragile products increase shipping costs.
- Precise compatibility mapping by make, model, and year prevents chargebacks and dangerous returns.
- Suppliers must provide structured feeds, consistent packaging, accurate inventory, and frequent updates. Automation boosts profits.
- Parts and outdoor gear require warranties, certifications, and recall procedures.
- Treat tactical gear as compliance-first without full supplier documentation.
SKU profitability by risk:
- Cleaning products and accessories: low complexity
- Floor mats and shades: medium risk
- Fitment-specific parts: high margin, high risk without precise mapping
- Wheels and drivetrain: high margin, high supplier risk
Bottom line: Success in these categories requires accurate specs, reliable supplier data, and strong margin protection. Use signals from top DTC brands to make smarter decisions and outperform competitors.
Conclusion
Success in 2026 requires you to build a repeatable system that identifies demand early, confirm supplier readiness, and execute before competitors.
Track what's working by filtering stores with rising traffic and ad activity. Identify profitability by spotting ads that run longer across channels. Analyze the creative systems behind winners. Confirm fulfillment viability before scaling spend.
Automation underpins everything. Clean data and structured feeds prevent pricing drift, inventory mismatches, and costly errors. Don't copy SKUs, recreate the strategies of successful brands. Launch confidently using real, validated signals.


.avif)
Ready to build a million-dollar brand?
.avif)
