Customer Lifetime Value Calculator (CLV / LTV)
Trendtrack's Customer Lifetime Value calculator estimates the total value a customer generates for your store over their entire relationship with you. Enter your average order value, purchase frequency and customer lifespan: the tool instantly computes your CLV, total orders and value per period.
What is Customer Lifetime Value (CLV)?
Customer Lifetime Value is the total revenue an average customer generates over the entire duration of their relationship with your brand, from first purchase to last.
Unlike a single isolated sale, CLV takes a long-term view: it recognizes that a customer who buys several times over two or three years is worth far more than one who buys only once.
Why does this matter so much in e-commerce? Because CLV is the natural counterpart of acquisition cost (CPA). If you know a customer is worth $300 over their lifetime, you can afford to spend far more to acquire them than if their value were only $40. CLV transforms your marketing: you stop asking “how much does a sale cost?” and start asking “how much is a customer worth?”.
This metric is central in three worlds:
- E-commerce – to steer acquisition budgets and loyalty programs;
- SaaS / subscription – to measure the profitability of a subscriber;
- Marketing – to identify the most profitable customer segments.
Customer Lifetime Value formula
The classic CLV formula is:
CLV = Average Order Value × Purchase Frequency × Customer Lifespanwhere:
- Average Order Value (AOV) – the average value of a single order;
- Purchase Frequency – the number of purchases per period (often per year);
- Customer Lifespan – the number of periods (often in years) the customer stays active.
Breaking down the intermediate metrics the tool computes:
Value per period = Average Order Value × Purchase Frequency
Total orders     = Purchase Frequency × Customer Lifespan
CLV              = Value per period × Customer Lifespan
There’s a “net” version of CLV that factors in margin and costs. The formula above calculates CLV in revenue (gross CLV). To get the value in profit, multiply the result by your margin rate — see our margin calculator.
CLV calculation examples in e-commerce
Example 1 — A fashion store
- Average order value: $60
- Purchase frequency: 3 times per year
- Customer lifespan: 2 years
Calculation:
Value per period = 60 × 3 = 180 / year
Total orders     = 3 × 2 = 6 orders
CLV              = 180 × 2 = 360
Result: a CLV of $360. On average, each customer brings in $360 in revenue. If your margin is 40%, their value in profit is ~$144 — that’s your reasonable ceiling for acquisition cost.
Example 2 — A cosmetics brand with high repeat purchase
- Average order value: $35
- Purchase frequency: 6 times per year
- Customer lifespan: 3 years
Calculation:
Value per period = 35 × 6 = 210 / year
Total orders     = 6 × 3 = 18 orders
CLV              = 210 × 3 = 630
Result: a CLV of $630. Even with a lower average order value, the high purchase frequency and loyalty generate a high lifetime value. This is typical of consumable products.
Example 3 — A premium one-time-purchase product
- Average order value: $250
- Purchase frequency: 1 time per year
- Customer lifespan: 1 year
Calculation:
Value per period = 250 × 1 = 250
Total orders     = 1 × 1 = 1 order
CLV              = 250 × 1 = 250
Result: a CLV of $250. A high cart value isn’t enough: without repeat purchases, lifetime value stays limited. The challenge for this store is to create opportunities for repeat buying.
How to use the CLV calculator?
The tool takes under a minute to fill in:
- Choose your currency ($, € or £).
- Average order value – divide your revenue by the number of orders over a given period.
- Purchase frequency – the average number of orders a customer places per period (usually per year).
- Customer lifespan – the average number of periods a customer stays active (in years).
The calculator then displays:
- CLV (lifetime value), the key metric;
- the total number of orders over the lifespan;
- the value generated per period.
Tip: if you don’t know your customer lifespan, estimate it from your retention rate. A common approximation: Lifespan ≈ 1 / (1 − annual retention rate). With 50% retention, the lifespan is about 2 years.
How to find your data (AOV, frequency, lifespan)?
- Average order value (AOV):
Total revenue ÷ Number of orders. Available directly in your Shopify dashboard. - Purchase frequency:
Total number of orders ÷ Number of unique customersover the period. - Customer lifespan: derived from your retention rate, or observed from your historical cohorts.
The longer the period your data covers, the more reliable your CLV will be.
What is a good CLV?
A CLV is never judged on its own: it’s compared against your customer acquisition cost (CAC / CPA). The reference benchmark is the CLV:CAC ratio:
- Ratio < 1:1 – you lose money on every customer acquired. Critical.
- Ratio ≈ 3:1 – considered the healthy level for an e-commerce store.
- Ratio > 5:1 – very profitable, but it may also signal that you’re under-investing in acquisition and leaving growth on the table.
In other words, a CLV of $360 is excellent if your CPA is $100, but a problem if it exceeds $360.
Why CLV is essential for your store
- It sets your acquisition budget: knowing CLV tells you how much you can spend to acquire a customer profitably.
- It values retention: increasing purchase frequency or lifespan often has a far bigger impact on profit than acquisition alone.
- It guides product decisions: products that drive repeat purchases are CLV engines.
- It complements ROI and ROAS: those measure a transaction; CLV measures a relationship. It’s what justifies investing aggressively in ads today for profit tomorrow.
How to increase Customer Lifetime Value?
- Raise the average order value – cross-sells, bundles, upsells and free-shipping thresholds.
- Increase purchase frequency – email marketing, loyalty programs, subscriptions and post-purchase follow-ups.
- Extend customer lifespan – product quality, flawless customer experience and responsive support.
- Target the right customers from acquisition – not all customers are equal. Acquiring loyal customers from the start mechanically raises average CLV.
- Sell the right products – this is where Trendtrack comes in: spot winning products and the brands that build loyalty to construct a high-lifetime-value catalog.
Go further with Trendtrack
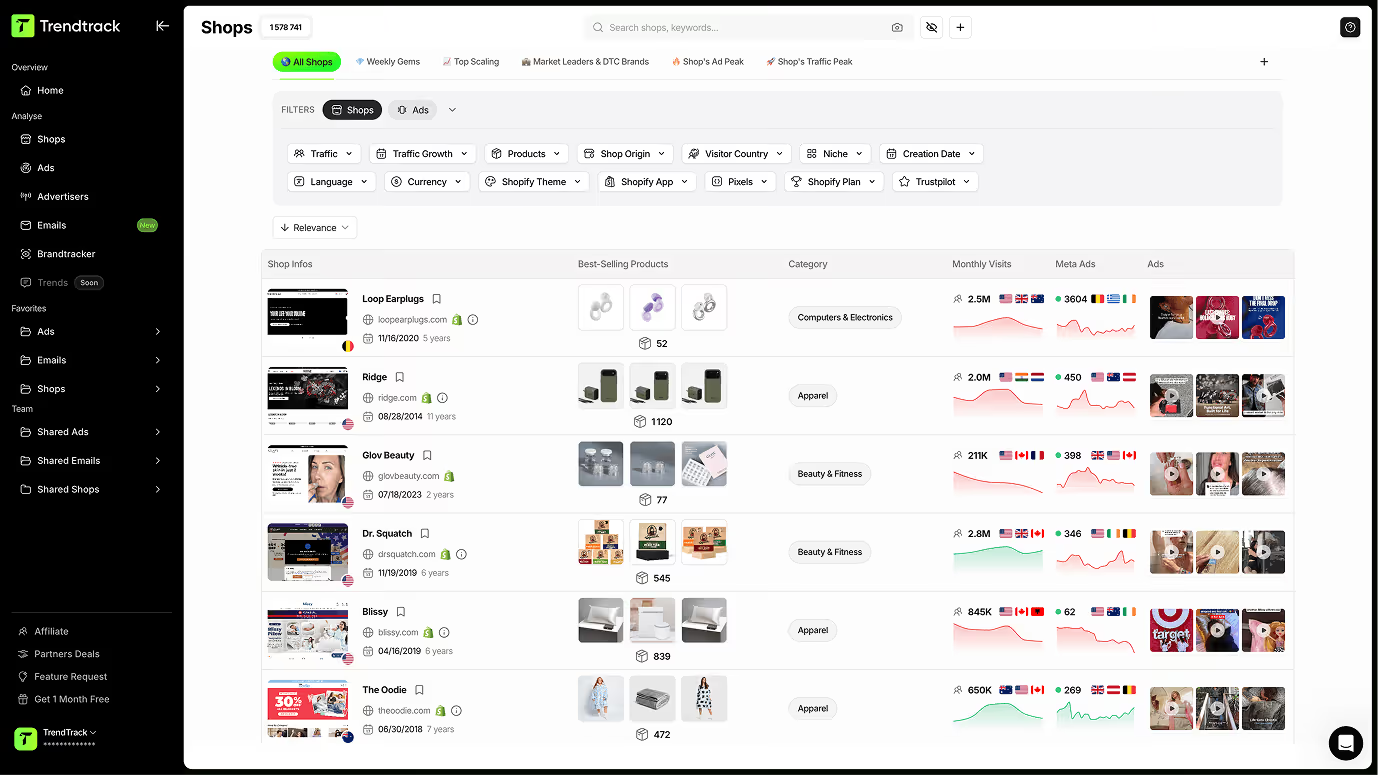
CLV tells you how much a customer is worth. Trendtrack helps you acquire the right ones: analyze the stores that succeed, spot winning products and the ads that convert, to build a durably profitable customer base.
Discover our other free tools too:
Häufig gestellte Fragen
Du findest keine Antwort auf deine Frage?
Kontaktiere uns, indem du hier klickst.
Die meisten Tools zeigen dir, was letzten Monat funktioniert hat. Wir zeigen dir, was heute funktioniert. Unsere Infrastruktur scannt täglich das gesamte Shopify- und Meta-Ökosystem – 2 bis 3 Millionen neue Anzeigen werden alle 24 Stunden indexiert. Keine Verzögerungen, keine redaktionellen Filter, keine subjektive Auswahl. Einfach der Markt, live.
Alle unsere Daten stammen direkt aus echten Quellen, keine erfundenen Zahlen, keine aus der Luft gegriffenen Schätzungen. Der Werbespend kommt direkt von Meta selbst. Der Store-Traffic wird von SimilarWeb bereitgestellt, dem zuverlässigsten Anbieter für Traffic-Intelligence der Branche. Alle 24 Stunden aktualisiert, liefert er dir das genaueste Bild davon, was gerade wirklich skaliert – stark genug, um Gewinner zu erkennen, aufkommende Brands zu verfolgen und Trends zu markieren, bevor sie ihren Höhepunkt erreichen.
Ja. Keine Verpflichtung, keine Vertragsbindung. Kündige jederzeit direkt über dein Konto.
TrendTrack ist die E-Commerce-Intelligence-Plattform, die sich einer Sache verschrieben hat: dir die genauesten und aktuellsten Marktdaten zu liefern, die es gibt. Jeder Store, jede Anzeige, jede Mail, jedes Spend-Signal – alle 24 Stunden aktualisiert. Denn zu wissen, was im E-Commerce gerade richtig läuft, bringt dir nur etwas, wenn "gerade" auch wirklich gerade bedeutet.
Für alle, die E-Commerce-Entscheidungen treffen und sich keine Fehler leisten können. Einsteiger, die ein Produkt validieren, bevor sie einen Euro ausgeben. Operator, deren Ads ausbrennen und die frische Angles brauchen. Brands und Agenturen, die Marktverschiebungen erkennen müssen, bevor sie eintreten. Wenn deine Entscheidungen davon abhängen, zu wissen, was gerade wirklich funktioniert, ist das dein Tool.
Das ist eine der besten Möglichkeiten, deine ersten Schritte risikoärmer zu gestalten. Statt zu raten, siehst du genau, welche Produkte an Zugkraft gewinnen, welche Anzeigen skalieren und welche Nischen gerade richtig abgehen, alles in Echtzeit. Du verlässt dich nicht auf ein Bauchgefühl. Du verlässt dich auf live Marktsignale.
Ja. Der schnellste Weg, einen neuen Winkel zu finden, ist zu sehen, was bereits funktioniert – in deiner Nische und darüber hinaus. TrendTrack gibt dir Zugriff auf Millionen aktiver Creatives, sortiert nach Performance-Signalen und täglich aktualisiert. Der nächste erfolgreiche Hook läuft irgendwo schon. Wir helfen dir, ihn zu finden.
Das hängt von deinem Plan ab. Jeder Plan verfügt über eigene Zugriffsrechte und Nutzungsmöglichkeiten. Bevor du dich anmeldest, empfehlen wir dir, unsere Preisseite zu checken, um sicherzustellen, dass du den Plan wählst, der zu deinen Bedürfnissen passt.
Bereit, eine Millionen-Marke aufzubauen?
.avif)