How to Find Trending Dropshipping Products in 2025


Most dropshippers burn through ad budgets testing random products, hoping something sticks. They chase the same oversaturated items everyone else is selling. Generic phone accessories, fidget toys, and basic home gadgets all compete on razor-thin margins.
Success in product research isn't about luck or intuition. It requires a systematic approach to identifying demand signals before they become obvious to everyone else.
This guide reveals the data-driven methods that separate profitable stores from the ones that struggle. You'll learn how to spot emerging trends and validate market potential with real metrics. This lets you launch products with confidence instead of guesswork.
What Defines a Winning Dropshipping Product in 2025
The fidget spinner craze is a good example. Early sellers earned a lot, but most were left with unsold inventory. Viral trends cause sales spikes followed by crashes. The best products solve real problems or serve dedicated niches.
Think about long-lasting value. RFID-blocking wallets, for example, attract travelers and maintain steady demand regardless of social media trends. These products allow you to optimize ads and plan growth confidently, unlike chasing endless fads.
The Key Financial Metrics
It's exciting to get lots of views, but your business depends on solid numbers. Evaluate your product carefully by focusing on:
- Profit margin: This is your business’s engine. What remains after fees, costs, and shipping? A 3x markup (buy for $10, sell for $30) is a good starting point. Higher-priced items can be more profitable even with smaller margins.
- Perceived value and pricing: Price your product at a level customers accept. If similar products cost $20 online, selling yours for $50 won’t work. Find a balance: enough margin for profit, but fair enough to make customers comfortable, including shipping.
- Shipping costs: Shipping expenses often reduce your profits. Lightweight, compact products cost less to ship. This allows you to offer free or low-cost delivery and reduces cart abandonment.
How to Evaluate Market Demand Versus Competitor Saturation
Popularity alone doesn’t guarantee success. Avoid highly saturated markets where competition is fierce.
Look for products with strong demand but fewer quality competitors. Analyze leading stores to see if their ads are generic or weak. If you spot weaknesses, your better creative work can attract their customers.
Use tools to monitor ad performance and traffic. Don’t waste time guessing by endlessly scrolling.
Just because many suppliers appear on AliExpress doesn’t mean the product is heavily sold. Often, only a few stores scale with ads successfully.
Why Ad Viability is Crucial for Scaling Your Dropshipping Products
Even a great product won’t sell if you can't run profitable ads. You must acquire customers for less than their average order value.
What makes a product easy to advertise?
- It looks great on video.
- It addresses a clear need.
- It appeals to a passionate community that can be targeted.
Imagine a video showing a messy suitcase transformed by compression packing cubes. The message is clear, and the appeal immediate.
Before investing, ask:
- Can I create compelling videos or images for this product?
- Do I know exactly who to target?
- What creative ideas will make my ad stand out?
Test your ideas with real data, not guesses. This protects your budget and helps build a dropshipping business that grows steadily.
A Step-by-Step Framework to Find Trending Products
Finding the right dropshipping product is not luck. It requires systematically connecting clues to confirm demand and market potential. Many dropshippers quit after spotting a trend, but successful ones investigate further using real data, not guesses.
The fastest way to find winning products is to reverse-engineer what's already working with tools like Trendtrack. Before a product becomes an obvious bestseller, independent Shopify stores test new ideas.
Watch what's gaining momentum at these high-growth stores and analyzing their advertising strategies. After that, you can spot opportunities before the market saturates.
Spot High-Momentum Stores and Their Hero Products
Start with trending shops. These are Shopify stores seeing explosive growth in traffic, ad activity, or sales. In Trendtrack, you'll find a Trending Shops section that displays stores with recent momentum.
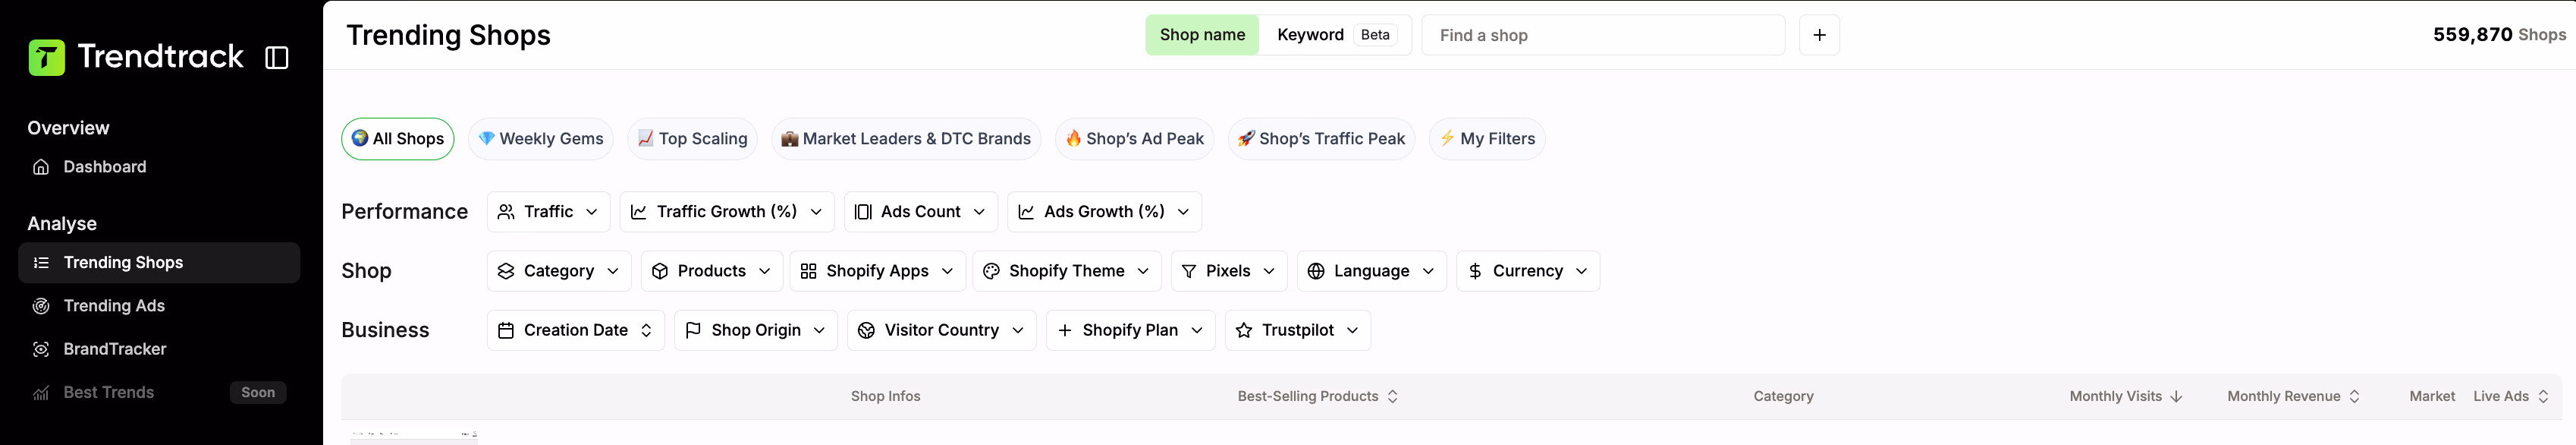
Focus on stores with a steep growth curve over the past 30–90 days. Filter for moderate traffic (10,000–100,000 monthly visits) rather than massive brands. These are the sweet spot where products are proven to work but the market isn't yet oversaturated.
Look at their best-selling products section to see which items are actually driving results. A store might list hundreds of products, but only a handful are getting real advertising and sales momentum.
Notice which categories they're pushing right now: skincare, sleepwear, pet supplies, travel essentials, or home gadgets? These patterns reveal what's heating up in the market.

For example, you may notice three to five trending shops pushing RFID-blocking wallets with consistently. That's a data signal worth investigating.
If one shop shows huge monthly visits with just 10 products focused on security accessories, you know that niche has real demand.
Once you spot a growing brand, document their hero products. Save or export the product lists from stores showing explosive growth. Pay special attention to stores running both paid advertising and organic traffic. This combination signals a scalable product rather than a viral one-hit wonder.
If you want to automate exporting top sellers and uncover long-running ads, try the best product research tool for dropshipping to speed up discovery and vetting. It pulls hero products, ad longevity, and cross-platform presence into a single view so you can prioritize real winners.
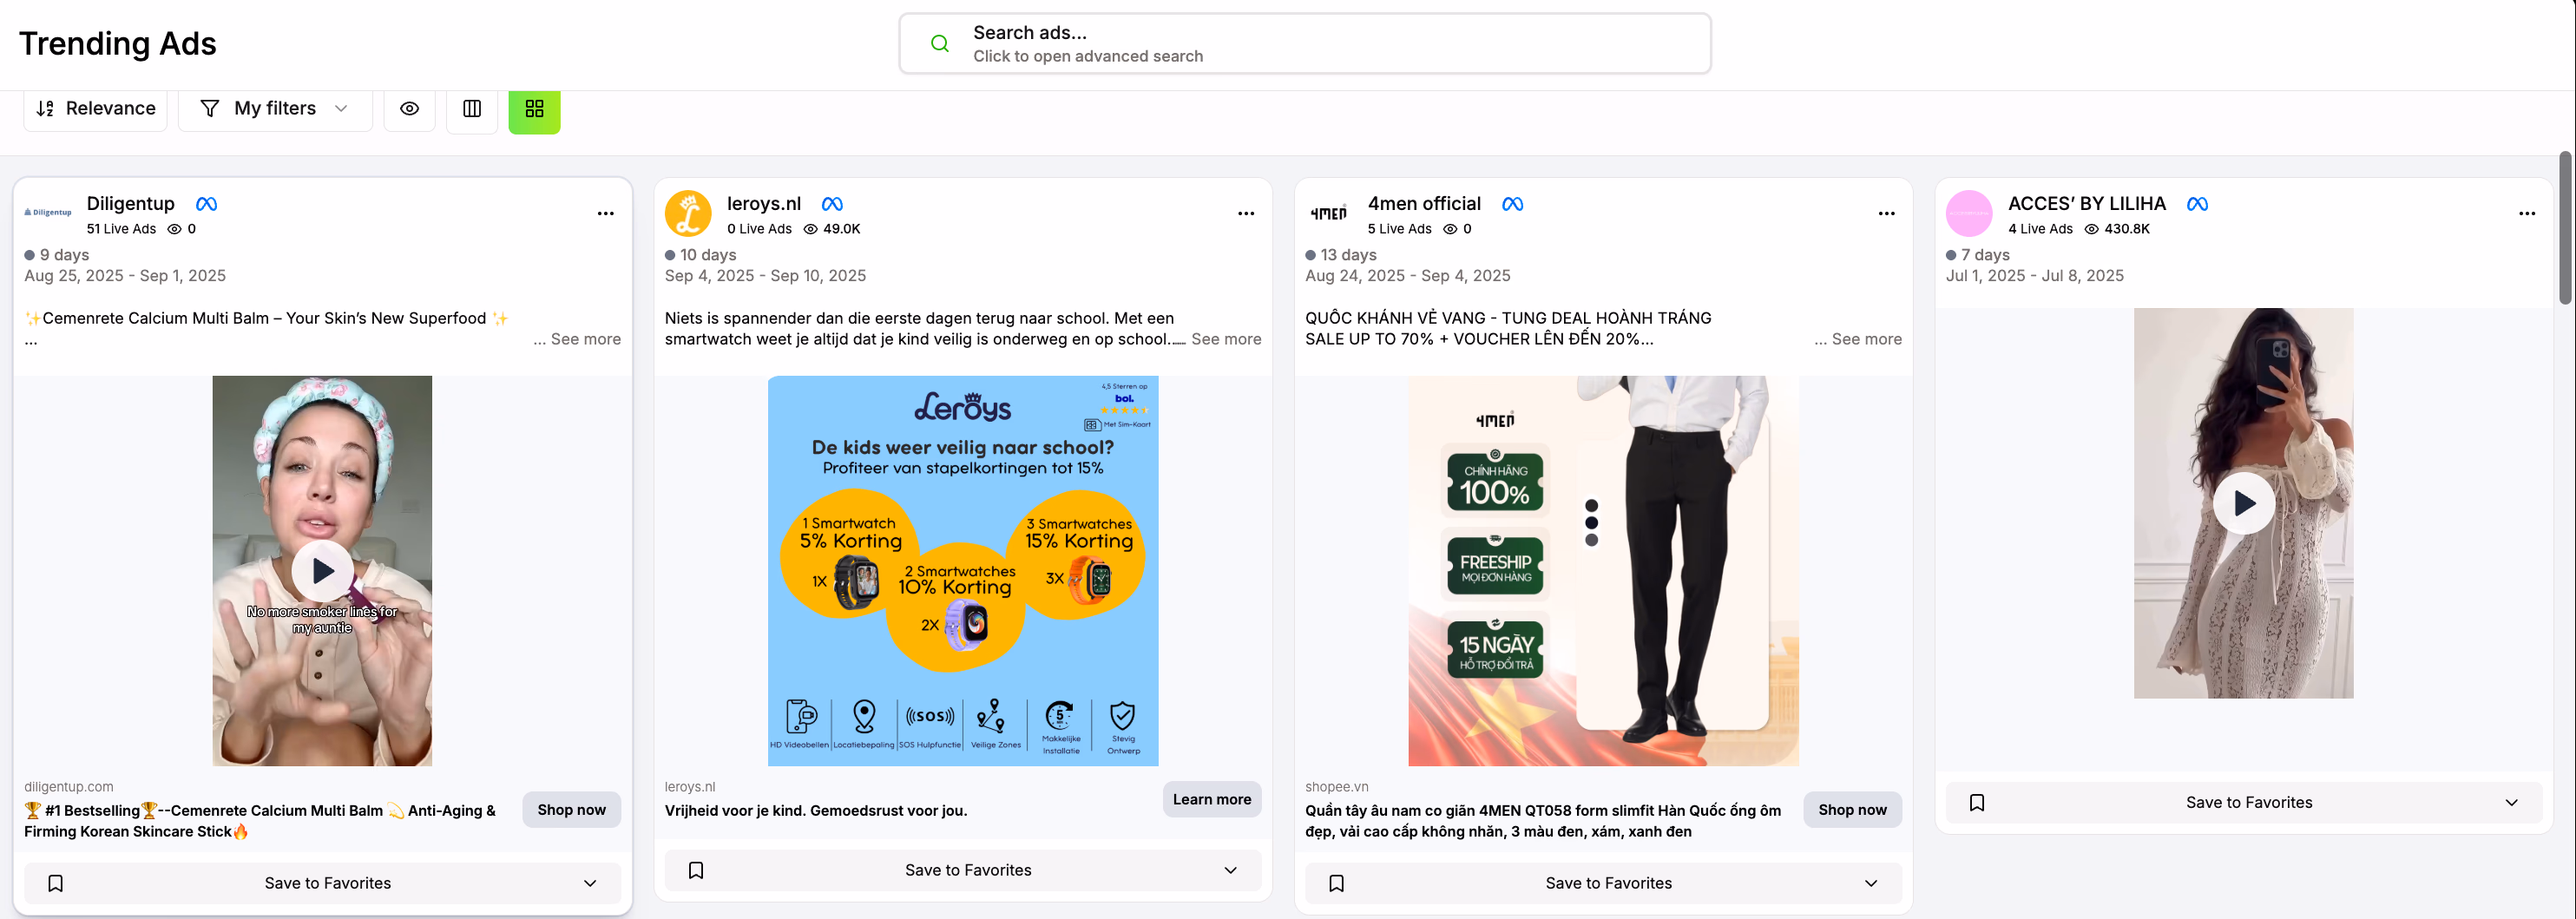
Analyze What's Driving Sales with Ad Intelligence
Now go deeper into the ads being run for these products. Successful stores test thousands of ad variations, and the ones that keep running for weeks or months are the proven winners.
Filter for ads running 7–30+ days or longer. Longevity signals profitability. If competitors continue running the same ad for weeks or months, it's working. Short-lived ads indicate poor performance.

If you see multiple variations of the same creative or message, competitors are scaling it, confirming that the angle resonates with audiences.
Look for ads with high volume from specific stores. If one store is running dozens of ads for similar products, they're testing aggressively. This indicates the category is profitable enough to warrant large-scale testing.
Monitor for cross-platform presence. Ads running on Meta, TikTok, and Pinterest simultaneously show that a product is viable across different audience types. Multi-platform commitment signals strong market confidence.
Create a spreadsheet of the top 5 performing ads for your target product. For each ad, take notes. The store running it, how long it's been active, how many variations exist, which platforms it's on, and the monthly ad spend.
This competitive profile helps you understand market saturation before you commit budget.
Once you identify ads that have been running successfully, download or screenshot 3–5 of them and analyze their structure. Does the hook open with a problem or a transformation?
For example, "Messy suitcase" → "Perfect organization." What is the angle—convenience, emotional benefit, or financial gain? Examine the visual style. Are they using user-generated content (UGC), professional product shots, or lifestyle imagery?

Document the exact ad copy, including headline, body text, and call-to-action. Look for common phrases or psychological triggers. Do ads use urgency ("Limited stock")? Social proof ("Join 50,000+ customers")? Pain-point framing?
Create a swipe file with 5–10 top-performing ad angles you can reference when building your own campaigns. You can replicate these proven angles and adapt them to create effective campaigns before spending money on unproven creative.
Dig Deeper with Brand Tracking and Live Performance Data
Pick a brand that runs high ad volume and dive into their complete ad strategy. This reveals exact creative patterns they're scaling.
Check their total active ad count. A store running 200+ ads across similar product categories is testing aggressively. Tools like BrandTracker will be effective in this manner.
Most of these ads will be variations testing different hooks, visuals, and copy. When you see 10+ duplicate ad variations for the same product over 90 days, they've clearly found a profitable formula.
Identify their top-performing creatives by engagement and longevity. Their top ads often feature simple, foundational products. Like a store known for luxury athleisure running ads for basic socks or workout essentials.
This signals they're driving volume from repeat customers buying staples, not just flashy drops.
View the landing pages connected to their top-performing ads. Successful ads are usually connected to high-converting landing pages. Prioritize URLs with 80%+ of ad traffic.
Visit these pages to study how the product is framed: what urgency tactics do they use? What social proof elements appear? How is pricing presented? What guarantees or risk reversals do they highlight?
Analyze their ad launch patterns over time. Look for campaign bursts, spikes that might indicate seasonal pushes, new product launches, or color drops.
For example, if you see significant ad volume increases in March–April, they're likely preparing for summer travel season. These timing patterns help you plan your own launch strategy.
Cross-Reference Multiple Data Sources for Final Validation
Now combine what you've learned from trending shops and ads with public search data. Consistent search growth for a product term shows genuine, organic demand beyond just social media buzz. Look for steady or rising trends over 3–6 months, not just recent spikes.
A product is worth pursuing when multiple signals align. Trending shops should be gaining consistent traffic week-over-week. Competitors should be running ads for 20+ days across multiple platforms.
Google Trends should show 3–6 months of steady or rising interest. You should have identified fewer than 20 major competitors actively advertising the product.

When fewer than 10 stores are actively scaling ads for a product, that's the early sweet spot. When that number jumps to 50+, the market is saturating.
Document your findings in a simple checklist: Does the product solve a real problem? Can I source it at a healthy margin (50%+)? Are there proven ad angles already working?
Is the market early-stage with room for entry? If you answer yes to these questions with real data backing each answer, you've found a product worth testing.
Verifying Demand with Data and Tracking Real Market Performance
This step determines if the interest you found is short-lived or lasting. Social media and marketplaces show heat, but deeper data reveals if the interest is a steady flame or a quick flare-up.
A TikTok trend may peak and fade fast. But consistent search growth for terms like "travel dropshipping products" shows genuine demand. Look for steady or rising trends over 3–6 months, not just recent spikes.
Set up Google Trends alerts for your target product keywords and monitor them weekly. A product with flat or declining search volume over 6 months is a red flag. The other one showing 10–20% month-over-month growth suggests healthy, sustainable interest.
Then cross-reference these search trends directly with Trendtrack's sales performance data. Trendtrack aggregates actual product sales estimates for stores using your product.
If Google Trends shows 15% month-over-month growth for "compression packing cubes" but Trendtrack shows declining sales estimates across top sellers, it signals the market is saturating despite search interest.
Conversely, rising search interest paired with rising sales estimates in Trendtrack is a strong validation signal.
{{cta-1}}
Analyze Keyword Mix for Market Maturity
Use keyword tools to dig deeper. Check if searches happen globally or locally. Notice which phrases people us. Like how to stay safe in an Airbnb versus buy portable door lock. A mix of informational searches and commercial searches means the market is mature and ready for new sellers.
Informational searches indicate awareness of the problem; commercial searches show purchase intent. The best products have both, indicating a market that understands the solution and is actively buying.
Cross-Reference Trends with Real Performance Data
This is where combining Trendtrack's intelligence with Google Trends becomes critical. Cross-reference trending search terms with active ad spend and actual product sales data. With that, you can tell if a product is scaling beyond just social media hype.
Trendtrack shows you real stores actively running ads and their estimated monthly revenue from specific products. You're no longer guessing based on viral videos. You're seeing proof that stores are investing in ads, maintaining inventory, and generating revenue from these products.
Look for stores in Trendtrack that are consistently ranked in bestseller sections month after month, paired with high ad activity. This combination indicates a product with both sustained customer demand and profitable unit economics.
Check the store's ad spend trends. If a store is increasing ad spend week-over-week for a product, it's a signal of scaling success.
If ad spend is declining, it suggests profitability issues or market saturation. If you like to learn how you can find trending products on spesific platforms like Amazon, you can check out article.
How to Calculate Your True Profit Margins and ROAS
Before committing to a product, run the numbers. A high retail price does not matter if costs erase your profit. The first hurdle is ensuring your product makes financial sense.
Don’t focus only on gross margins. Calculate your break-even point to confirm if you can afford ads.
For example, consider a trending mesh pet carrier backpack:
- Supplier cost: $8.50
- Retail price: $29.99
Break down the expenses:
- Cost of Goods Sold (COGS): $8.50
- Shipping and fulfillment: $4.00
- Transaction fees: about $1.17 (Shopify Payments at 2.9% + 30 cents)
The total cost per sale is $13.67. That leaves $16.32 profit per sale, which is the maximum amount to spend on customer acquisition without losing money.
Use a ROAS break-even calculator to verify your numbers. If you spend $20 on ads for one sale, you lose money. Understanding your margins gives you an advantage over competitors.
{{cta-2}}
The Non-Negotiable Process for Vetting Suppliers and Ordering Samples
If your product passes the numbers test, perform a reality check. Good margins mean nothing if the supplier is unreliable or ships defective items.
Ordering samples tests quality and supplier reliability. While doing so, watch for:
- Communication: Are replies fast, clear, and helpful? Or are they brief and unhelpful?
- Shipping speed: How quickly does the sample arrive? Is tracking easy to monitor? This previews your logistics.
- Packaging: Is the item securely packed or thrown into cheap packaging? Bad packaging causes returns.
- Product versus pictures: Does the sample match the listing’s photos? Watch for differences in color, size, or material.
Skipping this step risks your entire business.
Common Mistakes to Avoid When Hunting for Trending Products
Many products that once seemed promising in dropshipping eventually fail. They drain time, money, and energy instead of delivering profits. Avoiding these common pitfalls early helps you build a scalable business rather than just hustling.
Recognizing the Red Flags of an Oversaturated or Declining Trend
Riding a viral wave sounds appealing, but most entrepreneurs join too late when the trend is already fading. Trends typically follow a pattern. Early buzz, peak popularity, then rapid decline as competitors enter and customers lose interest.
If you launch a product after it has 50+ competitors using similar ads, you’re entering an oversaturated market. Other signs include stalled or dropping store traffic despite high ad spending. Instead of competing in a crowded space, focus on emerging trends with fewer sellers.
Why Focusing Only on "wow-factor" Products Can Hurt Your Business
“Wow-factor” products attract attention with flashy videos and novelty. However, they often lead to problems like frequent returns, customer questions, and one-time buyers. This approach rarely builds lasting businesses.
In contrast, problem-solving products in stable niches like travel perform better. Items such as RFID-blocking wallets or compression packing cubes address real needs.
These products attract dedicated customers who value solutions. This results in better conversions, stronger reviews, and brand trust. They often offer healthy profit margins of 50-70%.
How to Avoid Dropshipping Products with Shipping Nightmares
Finding a popular product with low competition is only part of the challenge. Shipping logistics can sink your profits if you’re not careful.
Bulky products like luggage look appealing due to high prices but come with hidden shipping costs. Shipping fees for oversized items can add 40-60% to expenses, often passed onto customers.
This causes over 22% of shoppers to abandon their carts when they see unexpected costs. Slow delivery from distant suppliers adds to the problem. Nearly 18% of customers abandon purchases due to long shipping times.
To protect your margins and conversions, choose lightweight, compact items. Sourcing locally also reduces delays and shipping expenses. This approach supports smoother launches backed by real data.
Start Finding Winning Products Today
Finding trending dropshipping products doesn't have to be a guessing game. The most successful sellers combine social media research, competitor analysis, and data-driven validation. This comprehensive approach happens before investing in inventory or ads.
Remember these key takeaways:
- Monitor TikTok, Pinterest and Instagram for early signals before products reach mass saturation
- Use Trendtrack's store analytics to identify which products are driving actual revenue, not just social engagement
- Validate every product idea against the profit margin checklist. Check for 30%+ margins, reasonable shipping costs, and scalable supplier relationships.
- Test small batches with minimal ad spend before scaling winners
Note which products appear consistently in their bestseller sections. Cross-reference with trending ads data to confirm they're actively scaling these items.
Your next winning product is hiding in plain sight - you just need the right tools to spot it before your competitors do. The difference between struggling dropshippers and profitable store owners isn't luck - it's systematic research.


.avif)
Ready to build a million-dollar brand?
.avif)
