Break-Even Point In E-commerce: Definition, Examples

In e-commerce, revenue alone doesn’t mean success.
You can generate thousands in sales and still lose money. You can scale ads aggressively and still struggle with profitability. That’s why understanding your break-even point in e-commerce is absolutely critical.
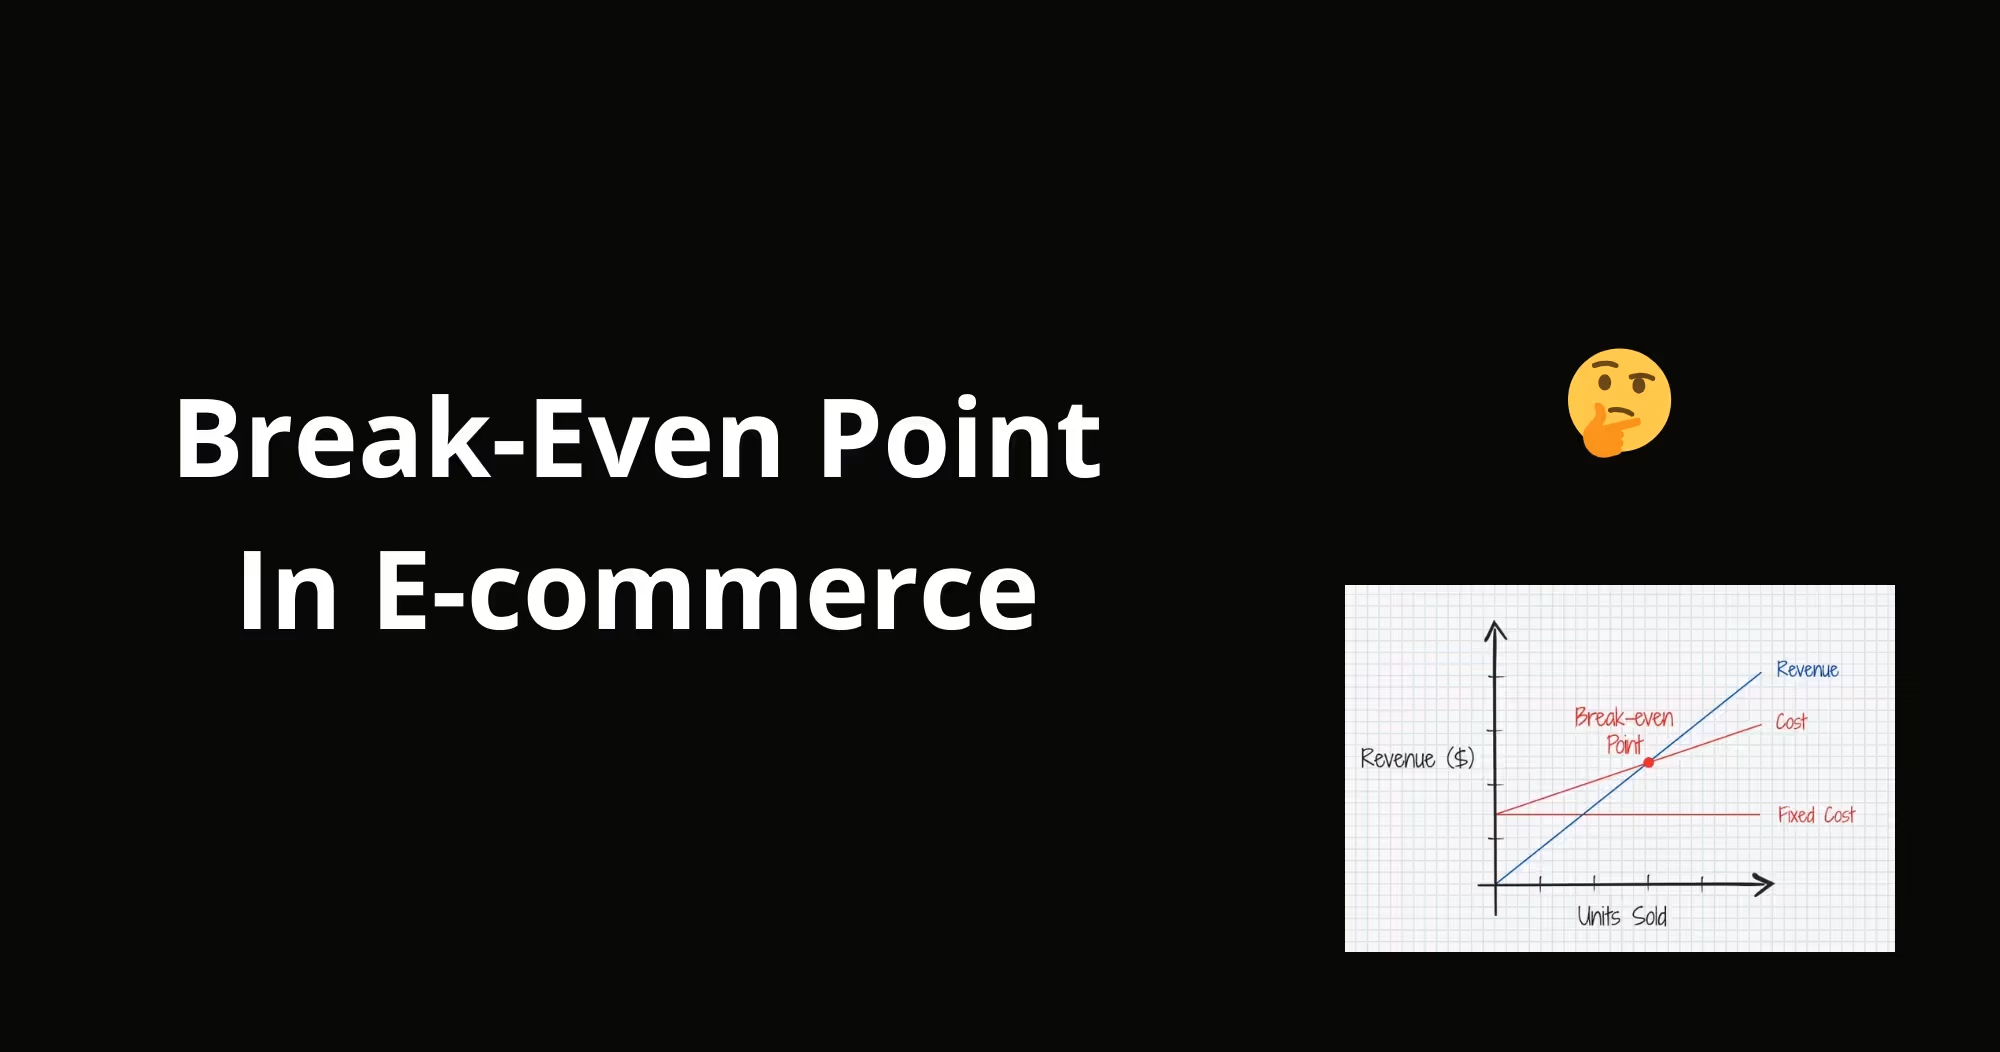
The break-even point is the moment when your total revenue equals your total costs. No profit. No loss. Just balance.
But in online retail, calculating this point is more complex than it sounds. You must consider product costs, shipping fees, transaction fees, advertising spend, fixed expenses, and even return rates. Without a clear break-even analysis, scaling becomes risky and sometimes dangerous.
If you don’t know your break-even point, you don’t know:
- How much you can afford to spend on ads
- What your minimum price should be
- Whether your margins are sustainable
- How many units you need to sell to stay profitable
In this article, we’ll break down the definition of the break-even point in e-commerce, explain how it works in practical terms, and walk through concrete examples so you can apply it directly to your Shopify or online store.
Because in digital commerce, growth without profitability is just expensive momentum.
Definition: Break-Even Point
The break-even point is one of the most fundamental concepts in business and especially in e-commerce. It represents the exact moment when your total revenue equals your total costs. At this point, your business is not making a profit, but it is not losing money either. You are financially balanced.
In simple terms, the break-even point answers one critical question:
How much do I need to sell to cover all my expenses?

In e-commerce, this concept becomes even more important because costs are not always obvious. Many online store owners focus on revenue growth without fully understanding the underlying cost structure. But revenue without cost awareness can quickly lead to negative margins.
To understand the break-even point clearly, you need to distinguish between two types of costs: fixed costs and variable costs.
Fixed costs are expenses that do not change regardless of how many units you sell. In e-commerce, these may include:
- Shopify subscription fees
- Software tools and SaaS subscriptions
- Website hosting
- Salaries (if applicable)
- Branding and design costs
These costs remain constant whether you sell 10 products or 1,000 products.
Variable costs, on the other hand, change depending on the number of units sold. These typically include:
- Cost of goods sold (COGS)
- Shipping costs
- Packaging
- Payment processing fees
- Advertising spend per sale
The break-even point is reached when the total revenue generated from your sales covers both fixed and variable costs combined.
Mathematically, the break-even point in units can be expressed as:
Break-even point (units) = Fixed Costs ÷ (Selling Price per Unit − Variable Cost per Unit)
The term (Selling Price − Variable Cost) is called the contribution margin. It represents how much each sale contributes toward covering fixed costs.
Once fixed costs are fully covered, any additional sale generates profit.
In e-commerce, this calculation is essential for understanding sustainability. If your fixed costs are $5,000 per month and your contribution margin per product is $20, you must sell 250 units just to break even. Only after those 250 units does your store begin generating profit.
But break-even analysis is not just about units. It can also be calculated in revenue terms:
Break-even revenue = Fixed Costs ÷ Contribution Margin Ratio
The contribution margin ratio is the percentage of each sale that remains after covering variable costs.
Understanding your break-even revenue helps you set realistic monthly sales targets.
In the e-commerce context, break-even analysis becomes even more critical because advertising plays a central role in acquisition. Many Shopify store owners underestimate the impact of customer acquisition cost (CAC) on profitability.
If your advertising cost per customer increases, your variable costs rise and your break-even point shifts upward. This means you must sell more units to remain profitable.
Break-even is therefore not static. It changes when:
- Ad costs fluctuate
- Supplier prices increase
- Shipping rates rise
- Discounts are applied
- Conversion rates improve
It is a dynamic indicator of financial health.
Beyond profitability, the break-even point also supports strategic decisions. It helps you determine:
Minimum viable pricing
Maximum allowable acquisition cost
Sales targets for new product launches
Feasibility of scaling advertising campaigns
Without break-even clarity, scaling becomes dangerous. You might increase ad spend thinking revenue growth equals success while margins silently shrink.
In competitive e-commerce markets, many brands fail not because they lack sales, but because they lack margin awareness.
The break-even point provides financial discipline.
It forces you to understand cost structure deeply. It reveals whether your pricing model is sustainable. It clarifies how much volume is required to support growth.
In simple terms, the break-even point is the foundation of profitability.
Before you focus on scaling, optimizing ads, or expanding internationally, you must know exactly how much you need to sell just to cover your costs.
How Do You Calculate the Break-Even Point in E-Commerce?
Understanding the theory behind the break-even point is essential but knowing how to calculate it is what truly protects your profitability. In e-commerce, where margins can shift quickly due to advertising costs, shipping fees, and supplier pricing, calculating your break-even point gives you financial clarity.
Let’s break it down step by step.
Step 1: Identify Your Fixed Costs
The first step in calculating your break-even point is determining your fixed costs.
Fixed costs are expenses that remain constant regardless of how many products you sell. In an e-commerce business, these often include:
- Shopify subscription fees
- App and SaaS tool subscriptions
- Website hosting
- Salaries or freelance retainers
- Branding and design expenses
- Software licenses
For example, if your monthly Shopify plan costs $79, your tools cost $300, and you spend $1,500 on fixed operational expenses, your total monthly fixed costs may equal $1,879.
These costs must be covered before you generate profit.
Step 2: Calculate Your Variable Cost per Unit
Next, determine your variable cost per unit.
Variable costs change depending on how many units you sell. In e-commerce, these typically include:
- Cost of goods sold (COGS)
- Shipping and packaging
- Payment processing fees
- Transaction fees
- Advertising cost per sale
For example, if:
- Product cost = $20
- Shipping and packaging = $5
- Payment fees = $3
- Average ad cost per sale = $12
Your total variable cost per unit would be $40.
This number is critical because it directly affects your margins.
Step 3: Determine Your Selling Price
Now, identify your product’s selling price.
Let’s assume your product sells for $70.
To calculate your contribution margin per unit, subtract variable costs from the selling price:
Selling price ($70) − Variable cost ($40) = $30 contribution margin
This means each unit sold contributes $30 toward covering fixed costs.
Step 4: Apply the Break-Even Formula
The formula for break-even in units is:
Break-even point (units) = Fixed Costs ÷ Contribution Margin per Unit
Using our example:
Fixed Costs ($1,879) ÷ $30 = approximately 63 units
This means you must sell 63 units per month to break even.
After selling the 63rd unit, each additional sale generates profit.
Step 5: Calculate Break-Even Revenue
You can also calculate your break-even point in revenue instead of units.
First, determine your contribution margin ratio:
Contribution Margin ÷ Selling Price
$30 ÷ $70 = 0.43 (or 43%)
Now apply the formula:
Break-even revenue = Fixed Costs ÷ Contribution Margin Ratio
$1,879 ÷ 0.43 = approximately $4,370
This means your store must generate $4,370 in monthly revenue to break even.
Revenue beyond that point becomes profit.
Why Break-Even Calculations Matter in E-Commerce
In e-commerce, break-even analysis is not static.
Your break-even point changes if:
- Advertising costs increase
- Supplier pricing changes
- Shipping fees rise
- Discounts reduce selling price
- Conversion rates improve
For example, if your cost per acquisition increases from $12 to $20, your contribution margin shrinks and your break-even point increases.
Without calculating this regularly, you may scale ads thinking you’re profitable, when in reality your margins are shrinking.
Break-even analysis helps you:
- Set minimum sales targets
- Determine sustainable ad budgets
- Decide if price adjustments are necessary
- Evaluate product viability before scaling
It also prevents dangerous scaling decisions.
If you don’t know how many units you must sell to cover costs, increasing ad spend can amplify losses instead of profits.
Break-Even Is a Strategic Tool: Not Just a Formula
The break-even point is more than a mathematical exercise. It is a financial compass.
It forces you to understand your cost structure deeply. It clarifies how pricing impacts profitability. It reveals how sensitive your business is to advertising fluctuations.
In competitive e-commerce markets, margins are often tight. Even small increases in acquisition costs can shift your break-even threshold significantly.
By calculating your break-even point consistently, you build financial discipline into your Shopify growth strategy.
And in e-commerce, disciplined scaling is what separates sustainable brands from short-lived ones.
How Can You Lower Your Break-Even Point in E-Commerce?
Lowering your break-even point in e-commerce is one of the smartest strategic moves you can make as a brand owner. The lower your break-even threshold, the faster you reach profitability and the safer your scaling becomes.
Before diving into tactics, let’s revisit the core formula:
Break-Even Point (Units) = Fixed Costs ÷ (Selling Price − Variable Cost per Unit)
The term (Selling Price − Variable Cost) is your contribution margin.
If you want to lower your break-even point, you have only three real levers:
- Reduce fixed costs
- Reduce variable costs
- Increase your contribution margin
Everything revolves around these fundamentals.
Let’s break down how a smart e-commerce manager should think about each lever.
Increase Your Contribution Margin Strategically
The most powerful way to lower your break-even point is to increase your contribution margin per unit.
If your fixed costs are $5,000 and your contribution margin is $25, you must sell 200 units to break even. But if you increase your margin to $35, your break-even drops to 143 units.
That’s a dramatic difference without increasing traffic.
You can increase your margin by:
- Raising your selling price
- Reducing variable costs
- Increasing average order value (AOV)
However, price increases must be strategic. You cannot raise prices blindly in a competitive market.
A strong brand manager asks:
- Does my positioning support a higher price?
- Can I improve perceived value (branding, packaging, storytelling)?
- Can I bundle products to increase AOV without increasing acquisition cost?
Increasing AOV through upsells and bundles is often smarter than raising base price. If customers buy more per transaction, your contribution margin per order improves lowering your break-even.
Reduce Customer Acquisition Cost (CAC)
In e-commerce, advertising is often your largest variable cost.
Since CAC is part of your variable cost per unit, lowering it directly improves your contribution margin.
If your variable cost is $40 including $15 in ad spend, and you reduce CAC to $10, your contribution margin increases instantly.
To reduce CAC, think strategically:
- Improve conversion rate (CRO optimization)
- Refine targeting and creatives
- Increase retargeting efficiency
- Strengthen organic traffic (SEO)
A small improvement in conversion rate reduces your effective cost per sale.
For example, if your conversion rate increases from 2% to 3%, your cost per acquisition drops significantly without increasing ad spend.
This is why conversion optimization is a financial strategy not just a UX tactic.
Reduce Fixed Costs Carefully
Fixed costs also impact break-even directly.
Break-Even Units = Fixed Costs ÷ Contribution Margin
If fixed costs decrease, required sales volume decreases.
However, reducing fixed costs must be strategic. Cutting essential tools or marketing resources can hurt long-term growth.
Instead, ask:
- Are there underutilized subscriptions?
- Can software tools be consolidated?
- Are operational processes efficient?
The goal is lean structure not underinvestment.
Increase Customer Lifetime Value (LTV)
While LTV doesn’t directly appear in the break-even formula, it influences profitability profoundly.
If customers purchase repeatedly, your effective acquisition cost per transaction decreases.
Example:
If you spend $20 to acquire a customer who buys once, your CAC is $20.
If that same customer buys three times, your CAC per order drops to $6.67.
Retention strategies lower your effective break-even threshold.
A strategic e-commerce manager focuses on:
- Email marketing automation
- Loyalty programs
- Subscription models
- Post-purchase engagement
Higher LTV creates margin stability.
Think in Systems, Not Campaigns
Lowering your break-even point is not about one tactic. It’s about system optimization.
Ask yourself:
- How sensitive is my model to rising ad costs?
- What happens if conversion rate drops by 0.5%?
- What happens if shipping costs increase?
Scenario analysis strengthens resilience.
Break-even should not be calculated once and forgotten. It should be reviewed monthly.
Because in e-commerce, small shifts in:
- Advertising costs
- Supplier pricing
- Return rates
- Discounting
can significantly affect profitability.
Strategic Mindset of a Strong E-Commerce Manager
A smart brand owner understands:
Revenue does not equal profit.
Scaling ads without margin clarity is dangerous.
Optimizing contribution margin reduces risk faster than chasing traffic.
Lower break-even = lower stress.
The goal is not just to increase sales volume. It is to build a model where profitability arrives sooner and scaling becomes safer.
When you increase margin, improve retention, reduce inefficiencies, and optimize acquisition costs, your break-even point decreases.
And when break-even decreases, your brand gains financial flexibility which is the real competitive advantage in e-commerce.
How Can You Use Break-Even Analysis to Scale Profitably?
Scaling an e-commerce brand without understanding your break-even point is like pressing the accelerator without checking your fuel level. Revenue may increase, but profitability can silently disappear. Break-even analysis is not just a defensive financial tool it is a strategic framework for scaling intelligently.
To scale profitably, you must first understand what break-even truly represents. Your break-even point tells you the exact level of sales required to cover both fixed and variable costs. Once you exceed that threshold, each additional sale contributes to profit. The goal of scaling is not simply to increase revenue, but to increase the distance between your revenue and your break-even threshold.
The first way to use break-even analysis strategically is to define your minimum viable performance targets. Before increasing ad budgets or launching new campaigns, you should know the minimum revenue required to cover costs. If your monthly fixed costs are $10,000 and your contribution margin per order is $40, you need 250 orders just to break even. Scaling makes sense only after this baseline is consistently achieved.
Break-even clarity also determines your maximum allowable customer acquisition cost (CAC). If your contribution margin per order is $40, you cannot sustainably spend $38 to acquire a customer unless retention justifies it. Break-even analysis forces discipline in advertising decisions. It helps you calculate how much you can afford to spend on paid acquisition while protecting margin.
For example, if your break-even point increases because advertising costs rise, you must either improve conversion rate, increase average order value, reduce variable costs, or raise pricing. Scaling without adjusting these variables risks amplifying losses instead of profits.
Another powerful use of break-even analysis is scenario planning. E-commerce markets are volatile. Advertising costs fluctuate, supplier pricing changes, shipping rates increase, and discount strategies impact margins. By modeling different scenarios, you can anticipate risk before it becomes a crisis.
Ask yourself:
What happens if cost per acquisition increases by 20%?
What if conversion rate drops by 0.5%?
What if I increase pricing by 5%?
Each adjustment shifts your break-even threshold. Strategic scaling requires understanding these sensitivities.
Break-even analysis also supports pricing decisions. Many e-commerce entrepreneurs underprice products in order to compete aggressively. However, small increases in price can significantly reduce required sales volume.
If your contribution margin increases from $30 to $35, your break-even volume decreases. This means you need fewer sales to reach profitability. Fewer sales required equals lower pressure on advertising and traffic generation.
Scaling becomes more stable when break-even is optimized.
Retention also plays a central role in break-even-based scaling. If you increase customer lifetime value (LTV), your effective acquisition cost per transaction decreases. This allows you to scale advertising more confidently because profitability is supported by repeat purchases.
Break-even analysis encourages long-term thinking rather than short-term revenue chasing.
Another key advantage of break-even discipline is capital allocation efficiency. Instead of reinvesting aggressively based on revenue spikes, you reinvest based on margin clarity. Scaling decisions become calculated rather than emotional.
For example, if you exceed break-even by a comfortable margin and maintain consistent contribution margin stability, you can gradually increase advertising budgets. But if you are hovering close to break-even, scaling may expose vulnerabilities.
In competitive e-commerce environments, the brands that survive long term are not those that grow fastest they are those that scale sustainably.
Break-even analysis transforms scaling from aggressive expansion into structured growth. It provides a financial safety framework that protects your brand from volatility.
Revenue growth feels exciting. Profit growth is strategic.
When you integrate break-even analysis into every major decision pricing, advertising, product launches, inventory expansion scaling becomes intentional.
You are no longer guessing whether growth is profitable. You are measuring it.
In e-commerce, profitable scaling is not about chasing traffic endlessly. It is about building a model where each additional sale widens the gap between cost and revenue.
Why Use TrendTrack’s Free ROAS Break-Even Calculator Tool?
When running paid ads in e-commerce, every dollar counts. Scaling without knowing your exact break-even ROAS is one of the most common and expensive mistakes founders make. Revenue may look strong, campaigns may generate sales, but without understanding your true profitability threshold, you could be scaling losses instead of profits.
TrendTrack’s free ROAS Break-Even Calculator is designed to eliminate that uncertainty. It gives you a precise, data-driven answer to one critical question: how much return on ad spend do you actually need to avoid losing money?

By entering your real numbers product cost, selling price, ad spend, shipping fees, and operational expenses the tool calculates your exact break-even ROAS and your maximum allowable CPA (Cost Per Acquisition). Instead of relying on generic industry benchmarks like “3x ROAS is good,” you get a customized profitability target based on your own margins.
This precision changes everything. A 2.8x ROAS might be profitable for one store and unsustainable for another. Without calculating your break-even point accurately, scaling decisions become guesswork. With TrendTrack’s calculator, guesswork disappears.
Another major advantage is live calculation updates. E-commerce is dynamic. Costs fluctuate constantly shipping rates increase, discounts impact margins, advertising costs shift, and average order value changes depending on your offers. The calculator updates instantly as you adjust variables. If you test a 10% discount, you immediately see how your break-even ROAS shifts. If you increase your average order value through bundles or upsells, you can see how much more flexibility you gain in ad spending.
This real-time modeling allows you to simulate scenarios before risking budget. Instead of learning through expensive trial and error, you forecast profitability in advance. That alone can save thousands in wasted ad spend.
Unlike basic calculators that oversimplify reality, TrendTrack’s tool supports complex cost structures. Many brands underestimate hidden costs such as warehousing, packaging, payment processing fees, and platform transaction charges. These small expenses add up quickly and significantly affect your contribution margin. By integrating all relevant operational costs, the calculator provides a realistic and comprehensive view of your profitability threshold.
In performance marketing, precision is leverage. Even a small miscalculation in cost per order can distort your break-even point and lead to aggressive but unprofitable scaling. Accurate modeling protects your margins.
The visual component of the calculator is equally valuable. Clear charts and structured data help you visualize your profitability buffer. You can instantly see how much room you have to scale before your campaigns become unprofitable. This clarity is critical when increasing budgets or testing new ad platforms.
Scaling ads should never be emotional. It should be calculated. When your campaigns consistently exceed your break-even ROAS, you gain confidence to increase spend strategically. When performance approaches your threshold, you know to optimize before scaling further.
This tool is particularly valuable for media buyers, marketing teams, and solo founders who need structured decision-making. It aligns advertising performance directly with financial sustainability. Instead of debating whether a campaign “feels profitable,” you measure it against your actual break-even benchmark.
Paid advertising becomes safer when grounded in numbers. The ROAS Break-Even Calculator transforms abstract metrics into actionable financial insight. It clarifies your allowable CPA, defines your profitability buffer, and supports smarter budget allocation.
In e-commerce, growth without margin clarity is dangerous. The brands that survive long term are those that scale with discipline. Understanding your break-even ROAS ensures that every scaling decision strengthens your business instead of weakening it.
TrendTrack’s free calculator gives you that clarity instantly. It replaces assumptions with precision and transforms ad scaling from risky experimentation into strategic expansion.
Break-Even Point FAQs
What is the break-even point in e-commerce?
The break-even point is the level of sales at which your total revenue equals your total costs. At this point, your online store is not making a profit, but it is not losing money either. It represents the minimum performance threshold your business must reach to be financially sustainable.
Why is the break-even point important for Shopify stores?
For Shopify and e-commerce businesses, the break-even point is critical because advertising costs, shipping fees, and supplier prices can fluctuate. Without knowing your break-even threshold, you risk scaling unprofitably. It helps you define minimum sales targets, set sustainable ad budgets, and evaluate pricing strategies.
What is the formula to calculate the break-even point?
The standard formula is:
Break-Even Point (Units) = Fixed Costs ÷ (Selling Price − Variable Cost per Unit)
The term (Selling Price − Variable Cost) is your contribution margin.
You can also calculate break-even in revenue:
Break-Even Revenue = Fixed Costs ÷ Contribution Margin Ratio
What are fixed costs in e-commerce?
Fixed costs are expenses that remain constant regardless of how many products you sell. These may include Shopify subscription fees, SaaS tools, website hosting, salaries, and branding expenses. They must be covered before your store becomes profitable.
What are variable costs in e-commerce?
Variable costs change depending on how many units you sell. In online retail, they typically include cost of goods sold (COGS), shipping, packaging, payment processing fees, and customer acquisition costs (CAC).
How does advertising affect the break-even point?
Advertising is often one of the largest variable costs in e-commerce. If your cost per acquisition increases, your contribution margin decreases which raises your break-even point. This means you must sell more units to cover costs.
How can I lower my break-even point?
You can lower your break-even point by:
- Increasing your selling price strategically
- Reducing variable costs
- Improving conversion rate
- Increasing average order value (AOV)
- Optimizing customer acquisition cost
- Reducing unnecessary fixed expenses
Improving contribution margin is the most powerful lever.
Does increasing revenue automatically improve profitability?
No. Revenue growth does not guarantee profitability. If your costs increase proportionally especially advertising costs your break-even point may rise. Scaling without margin awareness can amplify losses instead of profits.
How often should I recalculate my break-even point?
In e-commerce, you should review your break-even calculation monthly. Advertising costs, supplier pricing, shipping fees, and discount strategies can shift quickly. Regular updates ensure financial clarity and sustainable scaling.
Is break-even analysis only for new businesses?
No. Break-even analysis is essential at every growth stage. Early-stage stores use it to validate viability. Scaling brands use it to manage margins and protect profitability. Even established e-commerce businesses rely on it to forecast safely.
Useful Sources:
- TrendTrack – E-commerce Competitive Intelligence Tool:
/ - How to start dropshipping on shopify:
/blog-post/how-to-start-dropshipping-on-shopify - 10 Best Marketing Channels for E-Commerce in 2026:
/blog-post/10-best-marketing-channels-for-e-commerce-in-2026 - Why Analyze Your Competitors’ Best Sellers in E-Commerce:
/blog-post/why-analyze-your-competitors-best-sellers-in-e-commerce - How to Drive Traffic to Shopify:
/blog-post/how-to-drive-traffic-to-shopify - How to check competitors' traffic:
/blog-post/how-to-check-competitors-traffic


.avif)
Ready to build a millions dollars brand ?
.avif)
