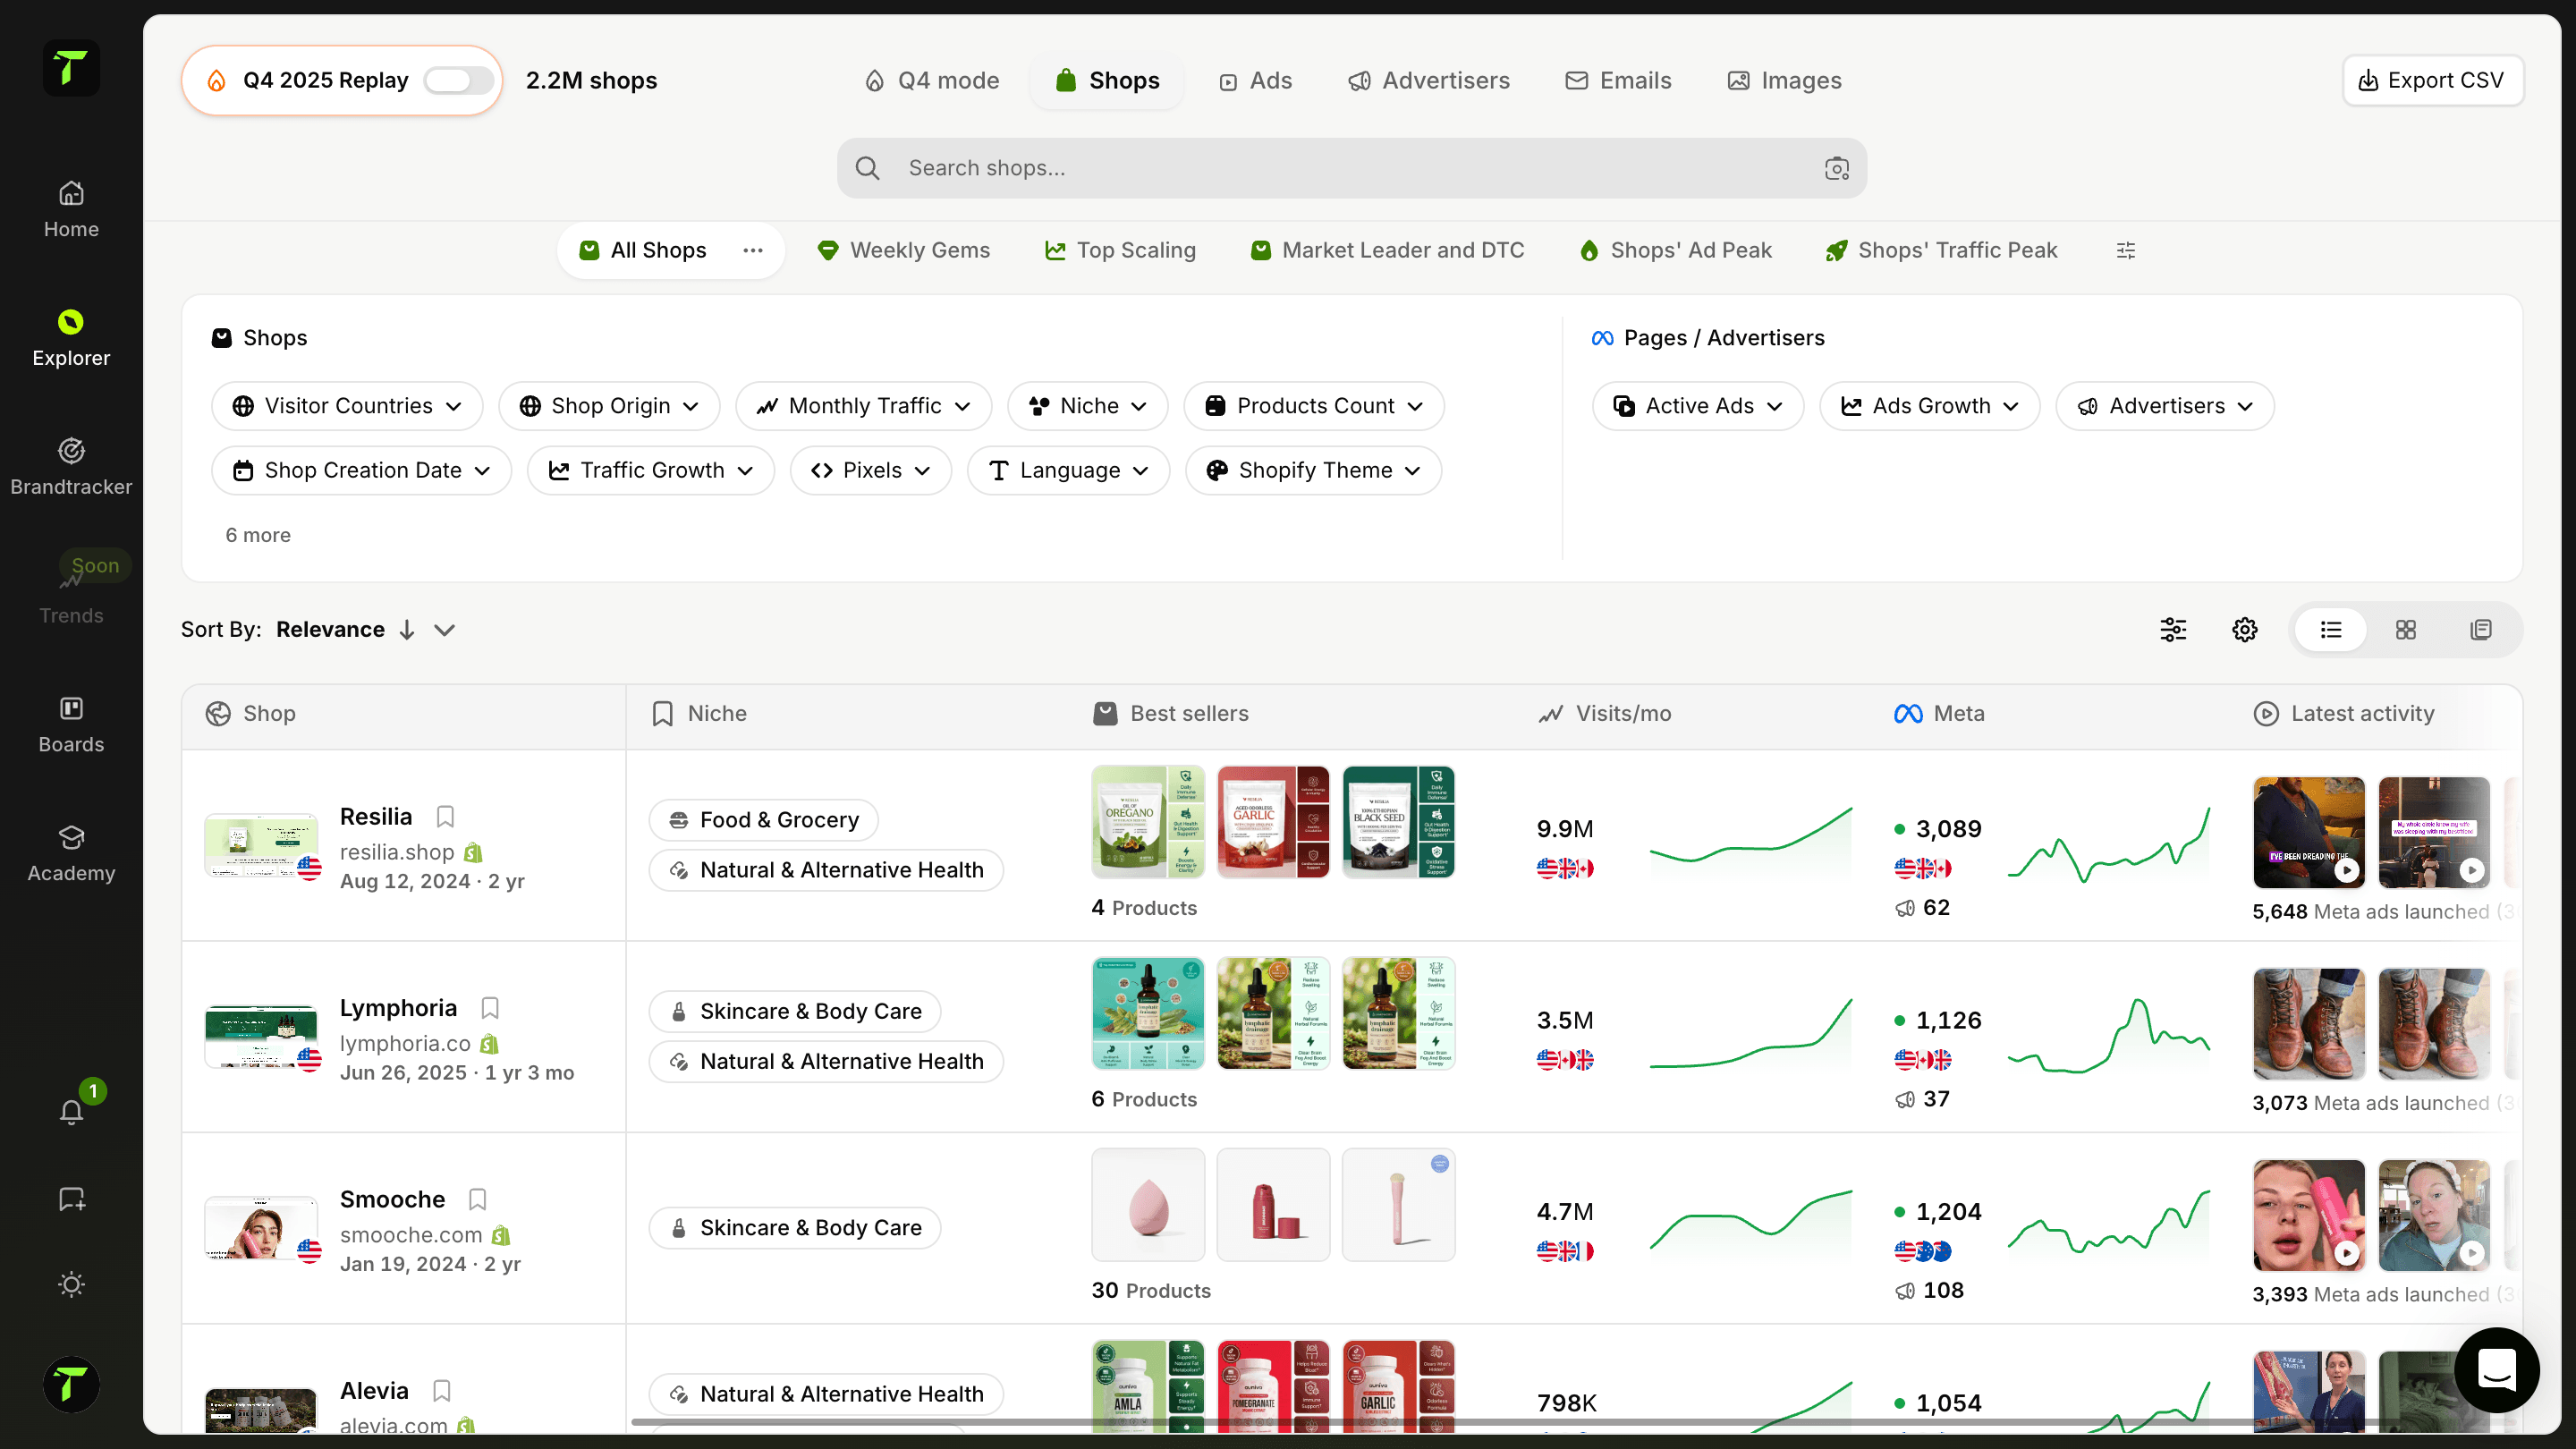
Sigue y monitoriza tus tiendas favoritas en tiempo real
Tu watchlist personal de tiendas para vigilar. Sigue y monitoriza métricas clave en tiempo real: anuncios activos, actividad publicitaria, campañas de email, tendencias de tráfico, novedades de producto y crecimiento en redes. Ve todas las tiendas que sigues en un único dashboard organizado.
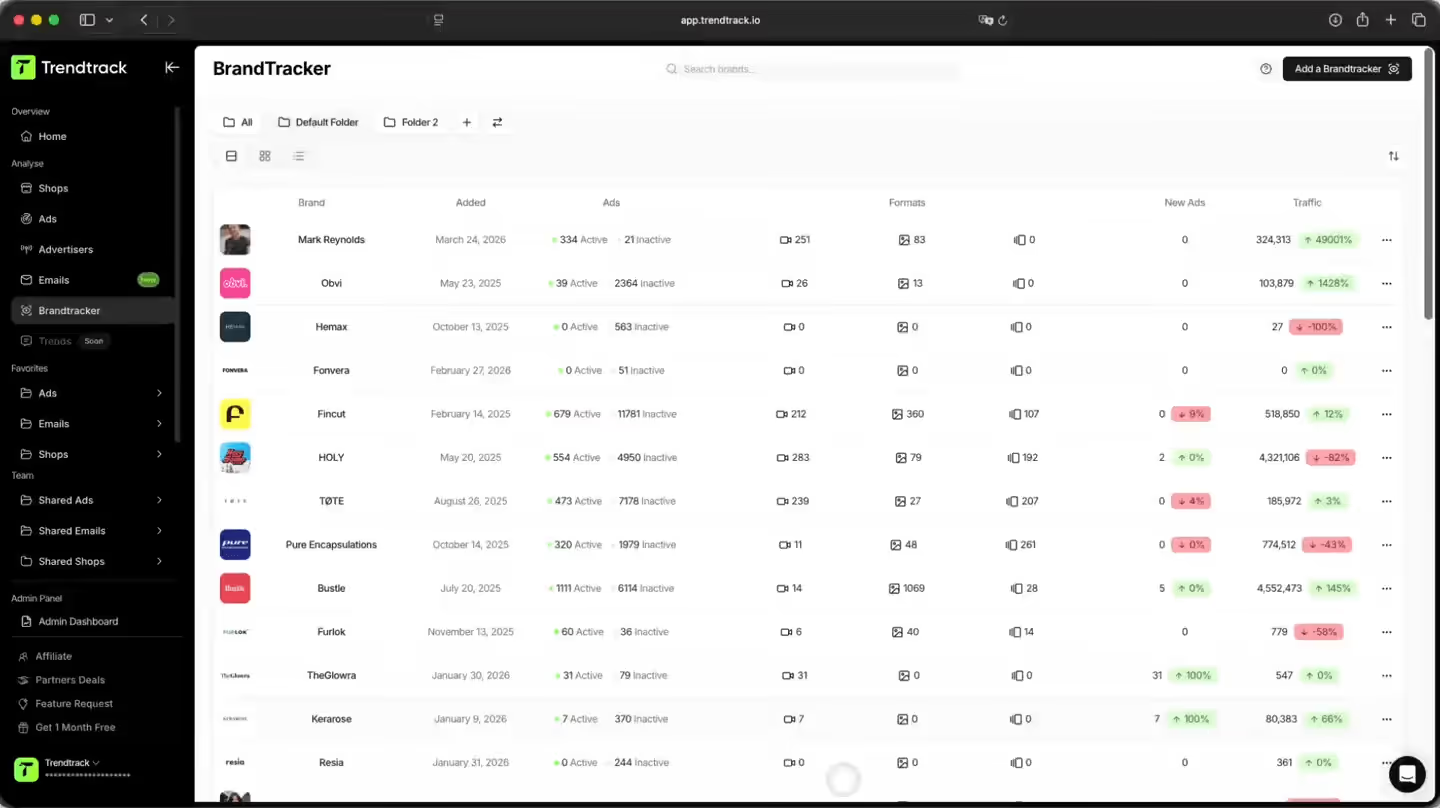
Una forma más inteligente de seguir tiendas en tiempo real
Tu watchlist de competidores en tiempo real. Sigue las tiendas que importan: anuncios activos, campañas de email, tendencias de tráfico, lanzamientos de producto, todo consolidado en un único dashboard en directo.

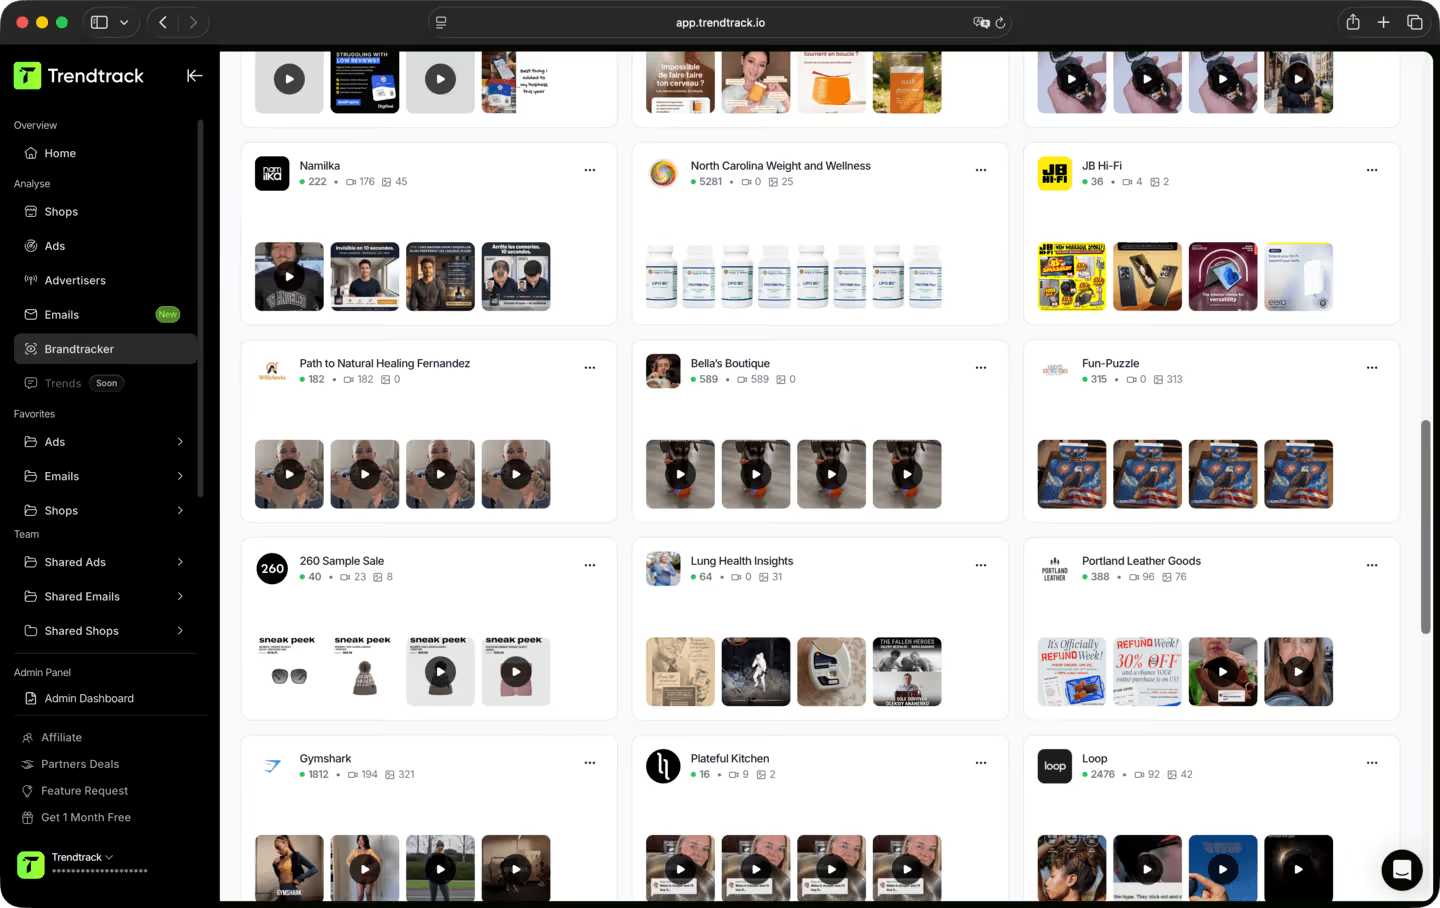
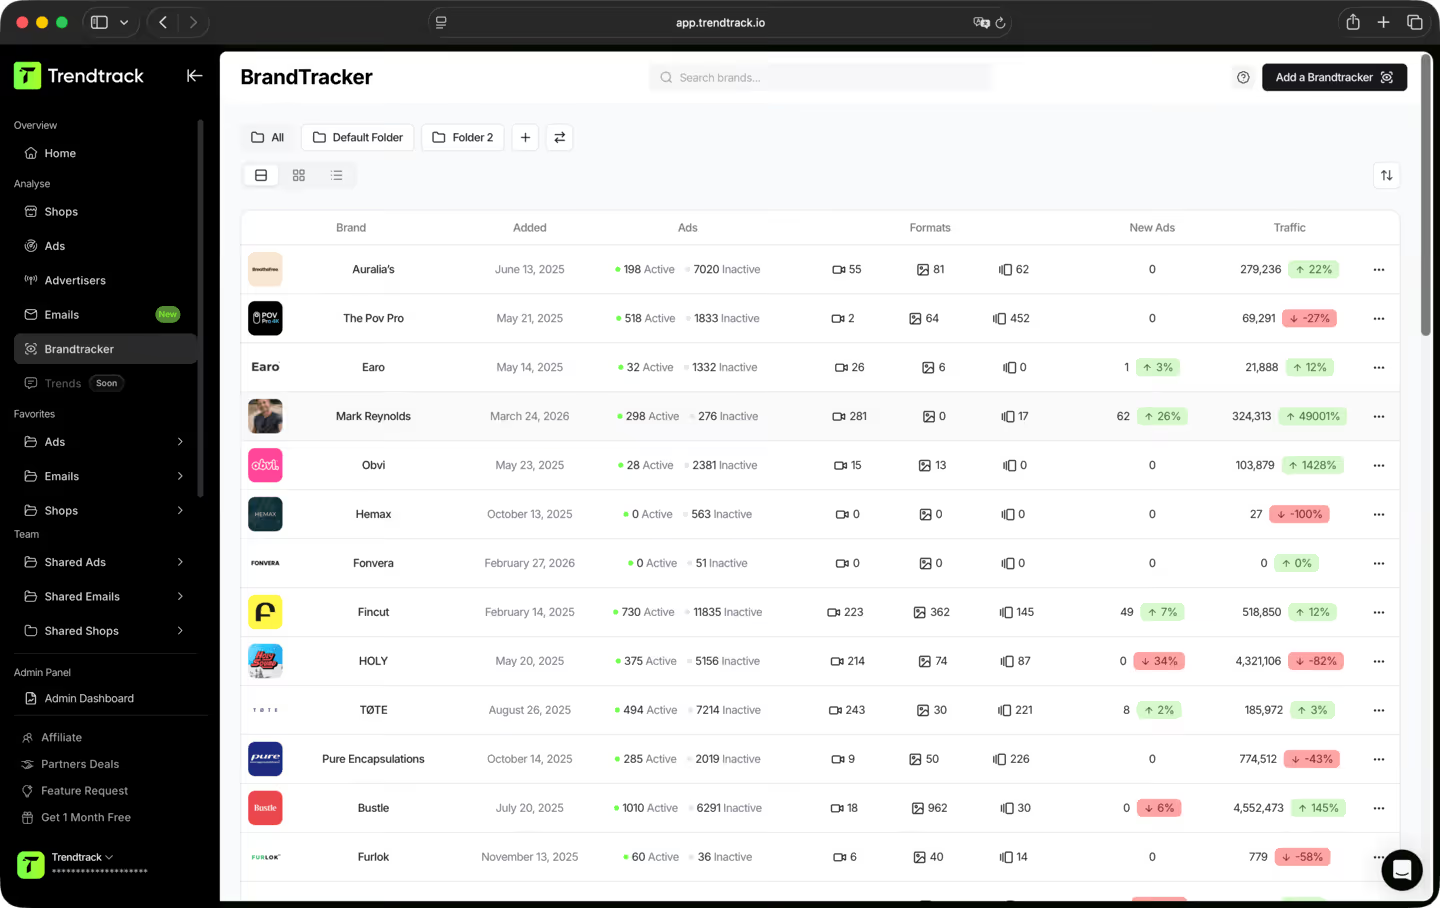
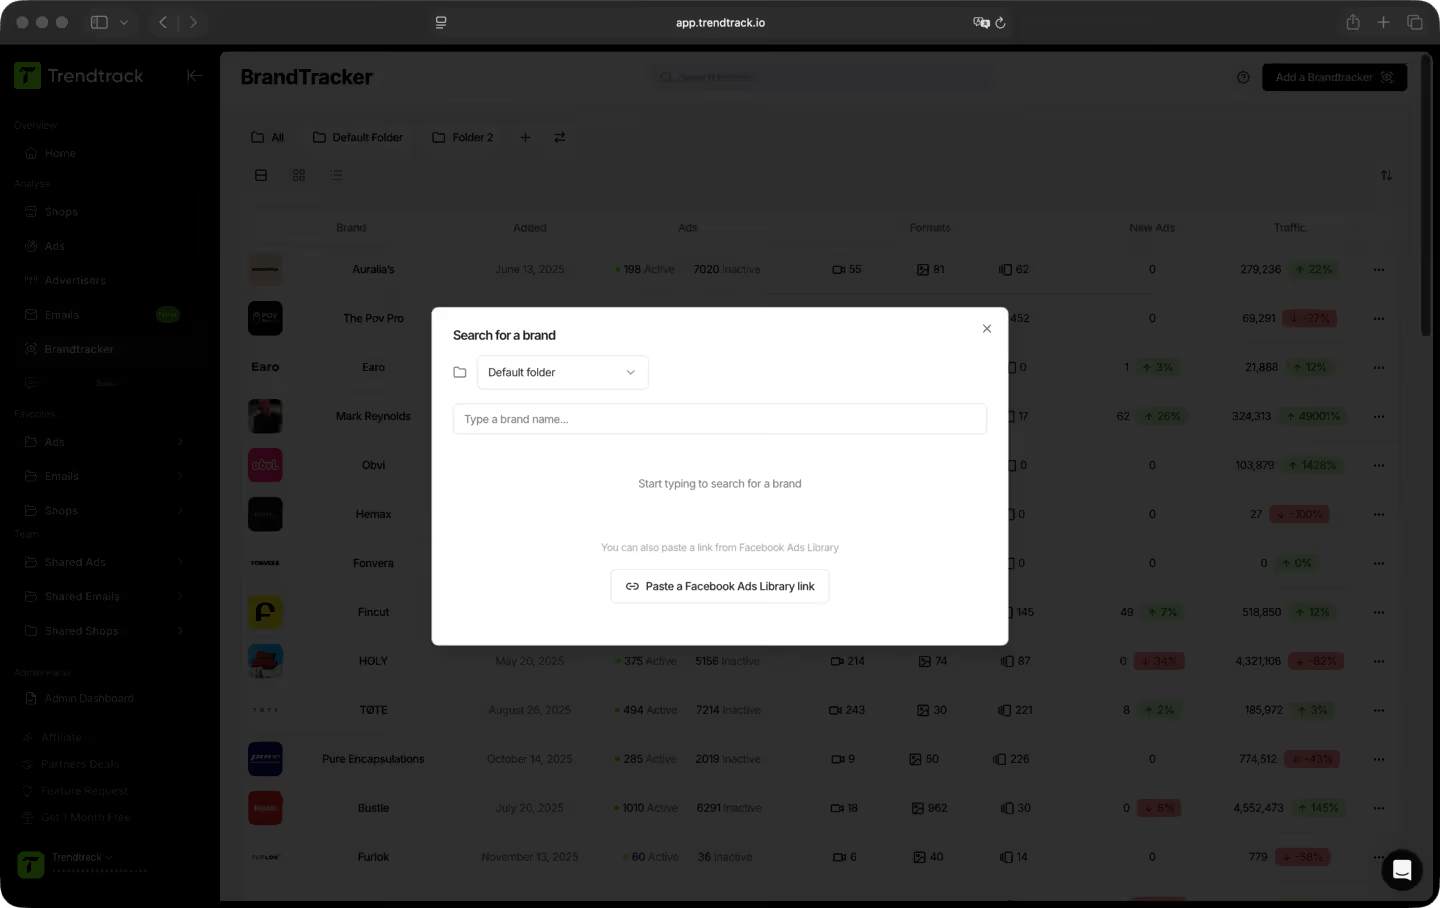
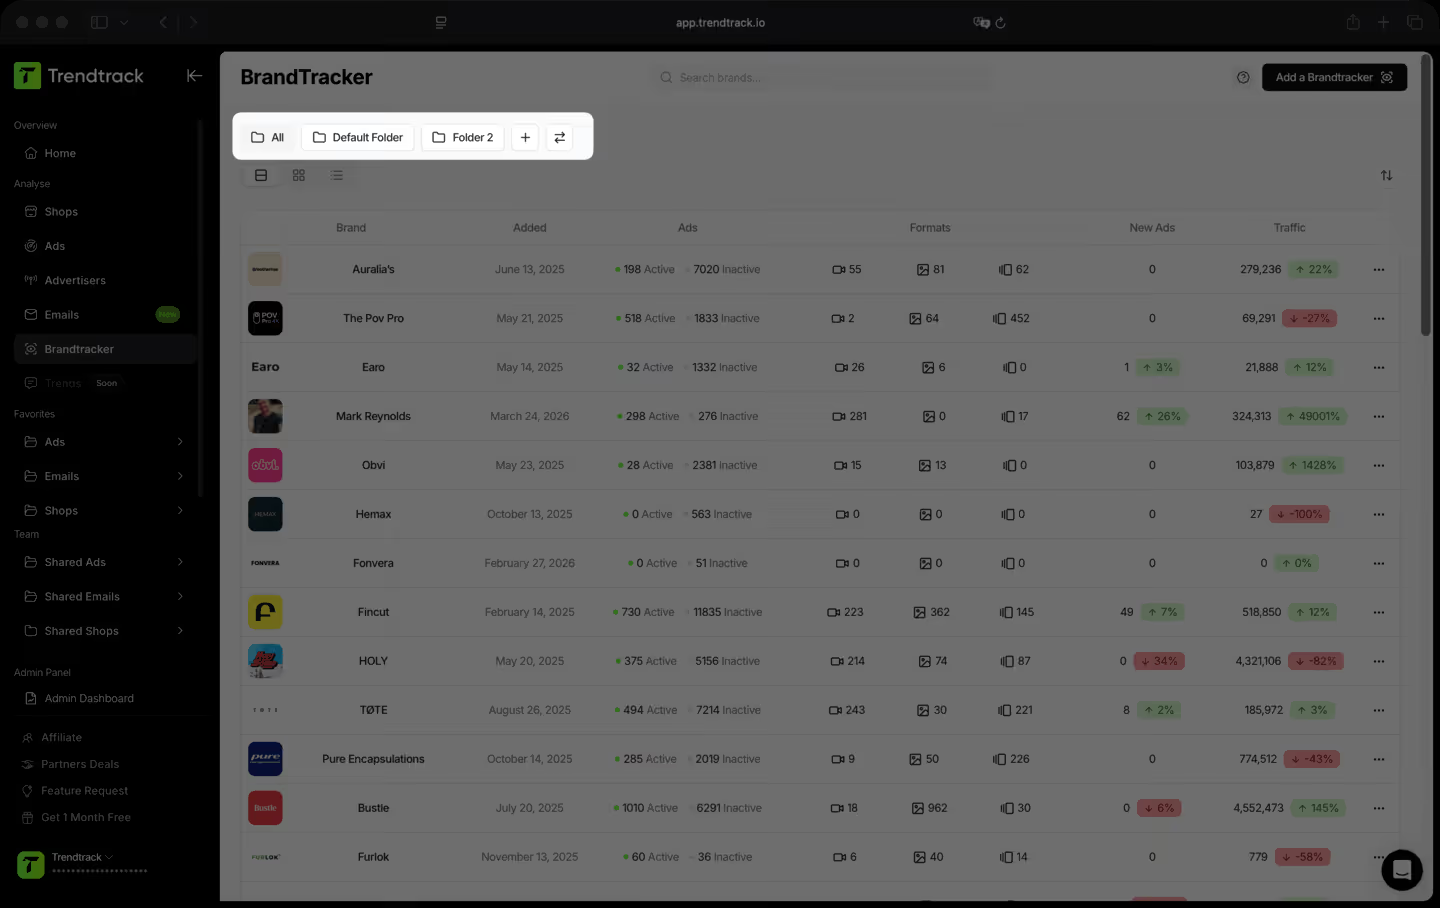
Un flujo de trabajo simple para monitorizar y comparar tiendas

Preguntas frecuentes
¿No encuentras la respuesta a tu pregunta?
Contáctanos haciendo clic aquí.
Sí. Sin compromiso, sin permanencia. Cancela directamente desde tu cuenta cuando quieras.
TrendTrack es la plataforma de inteligencia de e-commerce construida en torno a una obsesión: darte los datos de mercado más precisos y actuales que existen. Cada tienda, cada anuncio, cada email, cada señal de inversión, actualizados cada 24 horas. Porque saber lo que está ganando en ecom ahora mismo solo sirve si "ahora mismo" significa de verdad ahora mismo.
La mayoría de herramientas te enseñan lo que funcionaba el mes pasado. Nosotros te enseñamos lo que funciona hoy. Nuestra infraestructura escanea a diario todo el ecosistema de Shopify y Meta, de 2 a 3 millones de anuncios nuevos indexados cada 24 horas. Sin retrasos, sin filtros editoriales, sin selecciones subjetivas. Solo el mercado, en vivo.
Para cualquiera que toma decisiones de ecom y no puede permitirse equivocarse. Principiantes que validan un producto antes de gastar un dólar. Operadores cuyos anuncios se queman y necesitan ángulos frescos. Marcas y agencias que necesitan ver los giros del mercado antes de que ocurran. Si tus decisiones dependen de saber qué funciona de verdad ahora mismo, esta es tu herramienta.
Es una de las mejores formas de reducir el riesgo de tus primeros pasos. En lugar de adivinar, ves exactamente qué productos ganan tracción, qué anuncios escalan y qué nichos se calientan, todo en tiempo real. No apuestas por una corazonada. Apuestas por señales de mercado en vivo.
Sí. La forma más rápida de encontrar un nuevo ángulo es ver lo que ya funciona, en tu nicho y más allá. TrendTrack te da acceso a millones de creatividades activas, ordenadas por señales de rendimiento y actualizadas a diario. El próximo hook ganador ya está corriendo en alguna parte. Te ayudamos a encontrarlo.
Depende de tu plan. Cada plan incluye sus propios niveles de acceso y capacidades de uso. Antes de suscribirte, te recomendamos revisar nuestra página de precios para asegurarte de elegir el plan que encaja con tus necesidades.
¿Listo para construir una marca de millones de dólares?
.avif)