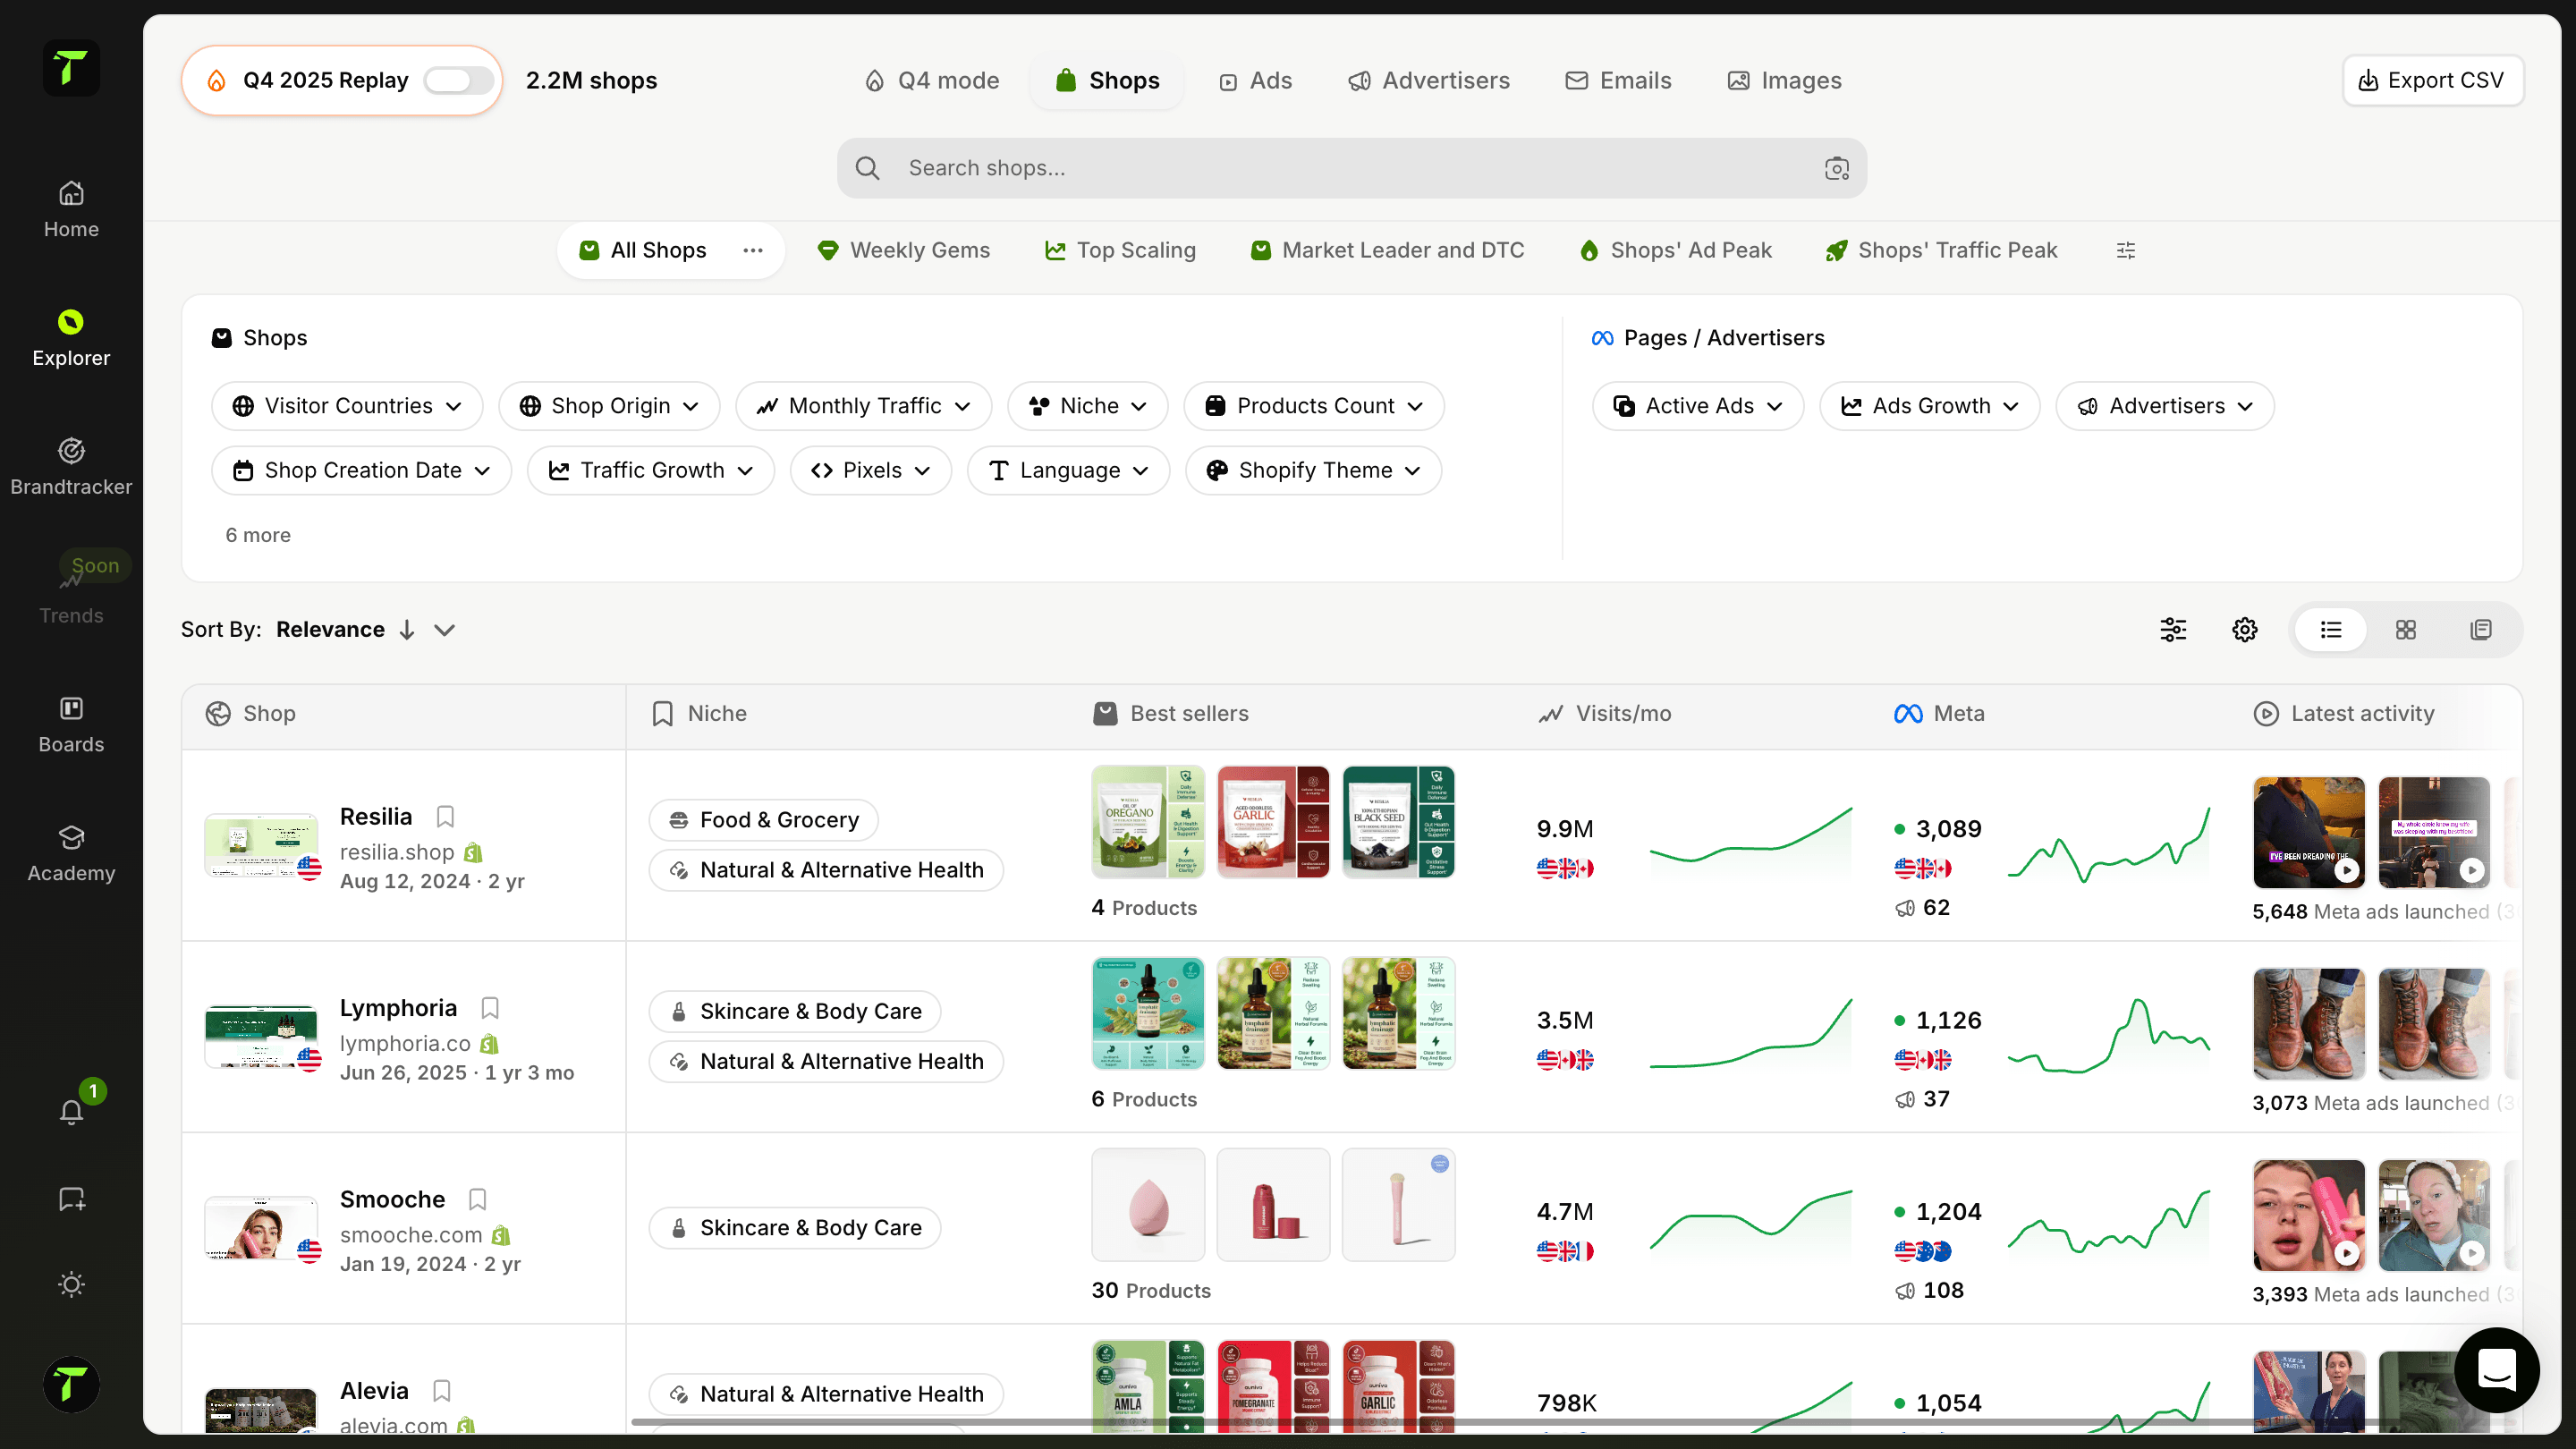
Duik diep in de Google ad-strategie en performance van elke shop
Een eigen tab in Shop Analytics met complete insights in de Google ad-campagnes van een shop. Analyseer hun ad history, top performing ads, formats (Search, Shopping, YouTube, Display), landing pages en headlines. Begrijp wat voor hen werkt en gebruik deze insights om je eigen strategie te verbeteren.
De slimmere manier om de Google ad-strategie van elke shop te analyseren
Duik in de complete Google ad-strategie van een shop. Verken de volledige ad history, spot de top performers, zie welke formats ze scalen en haal de patronen achter hun beste campagnes eruit.

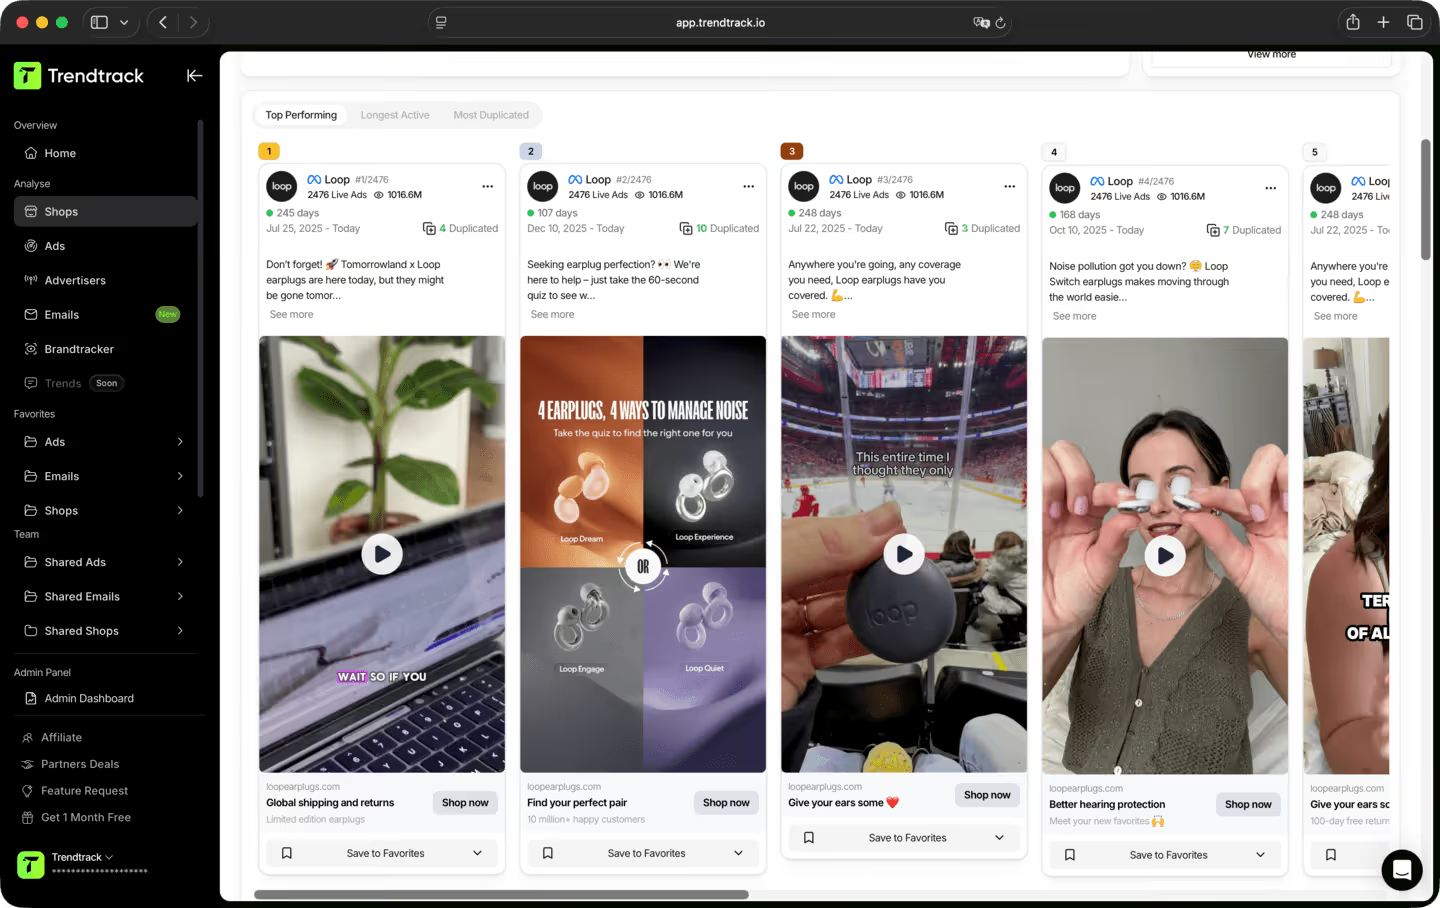
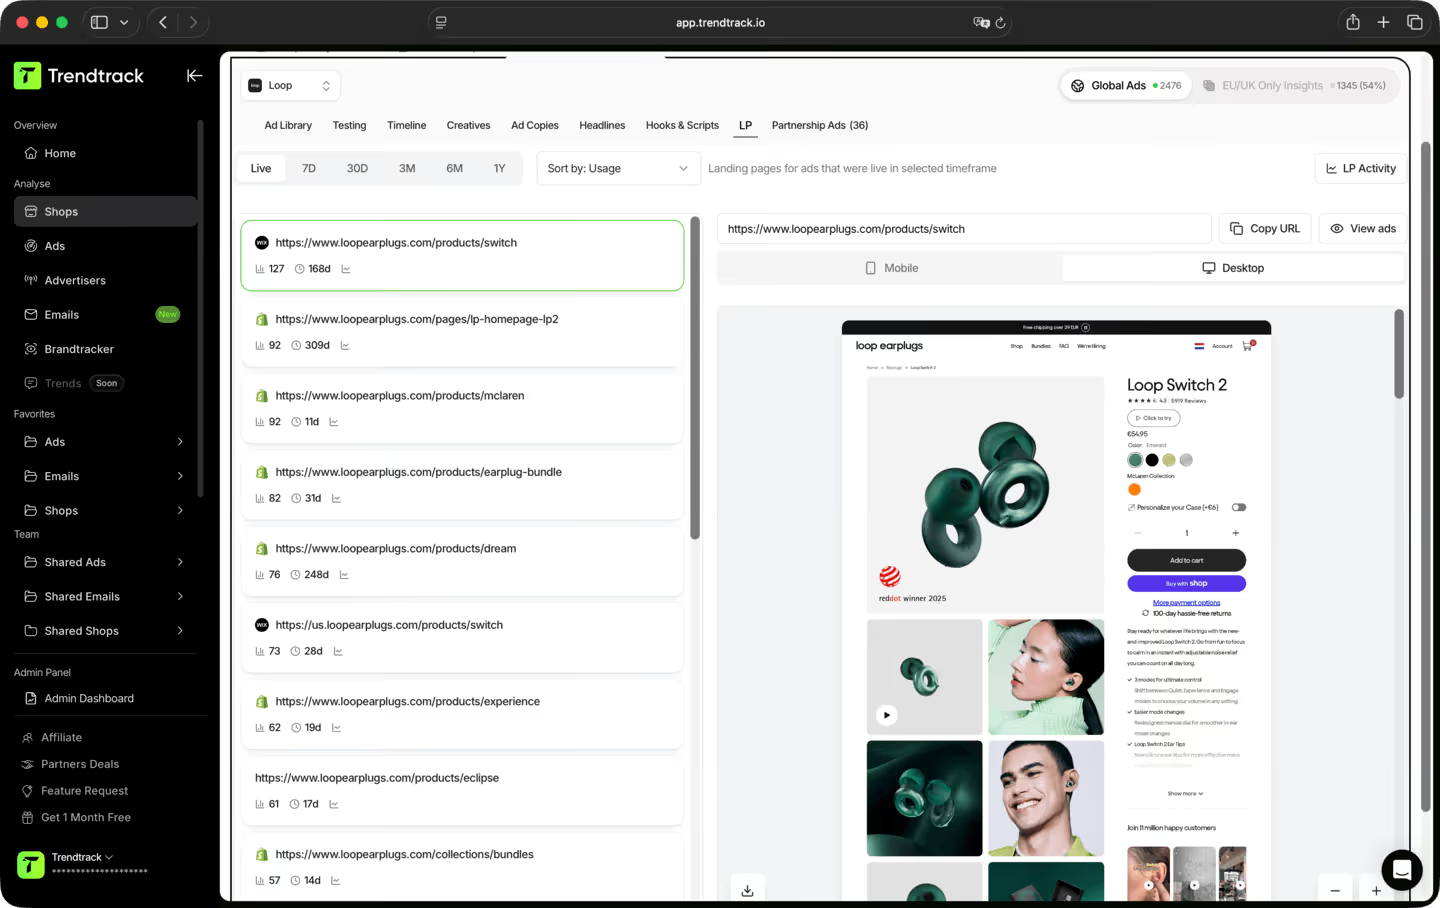
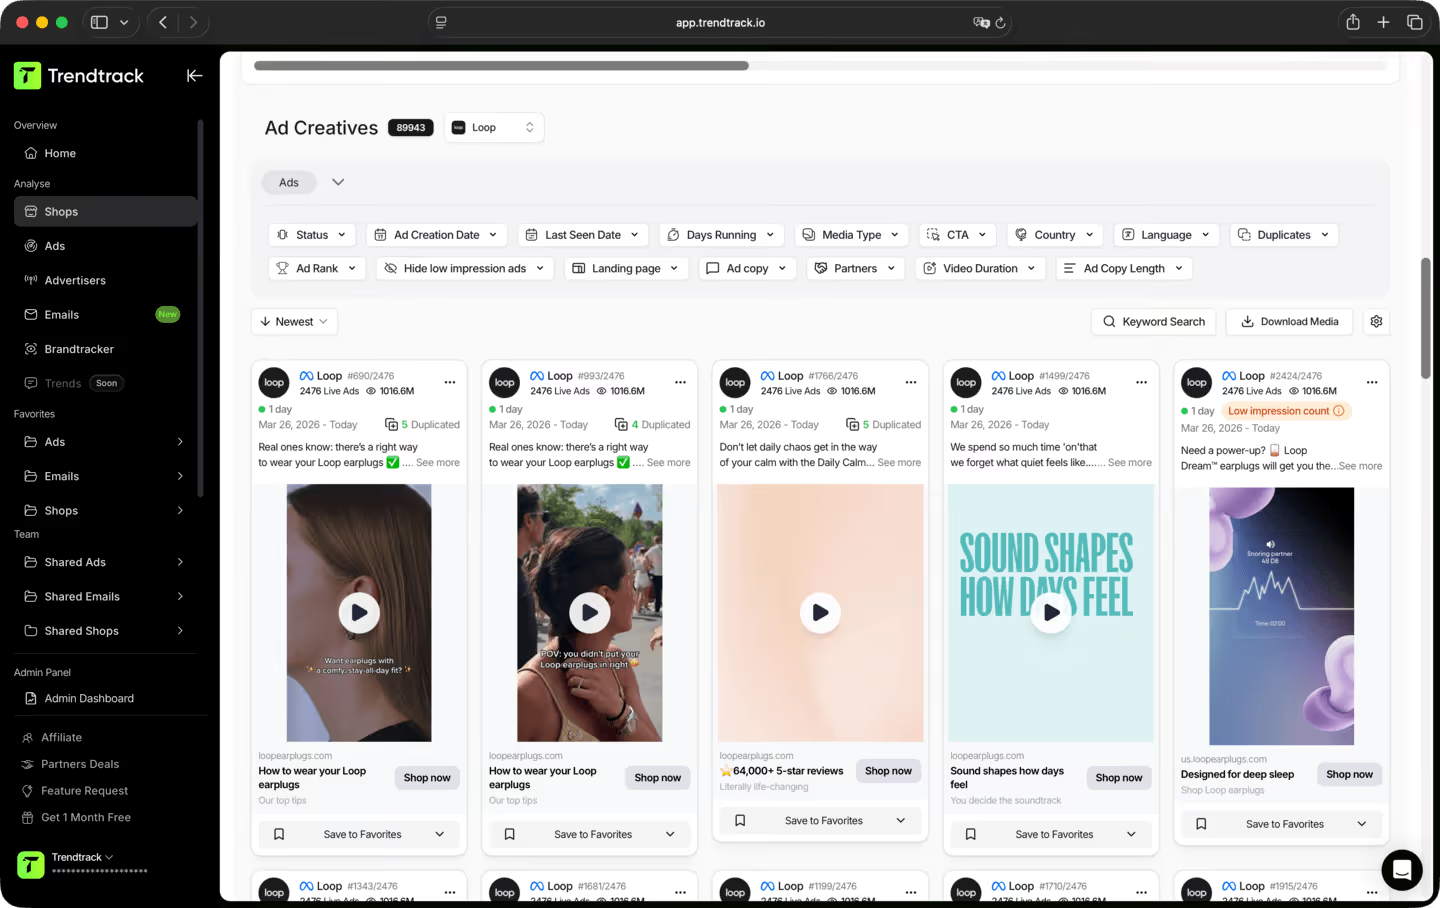
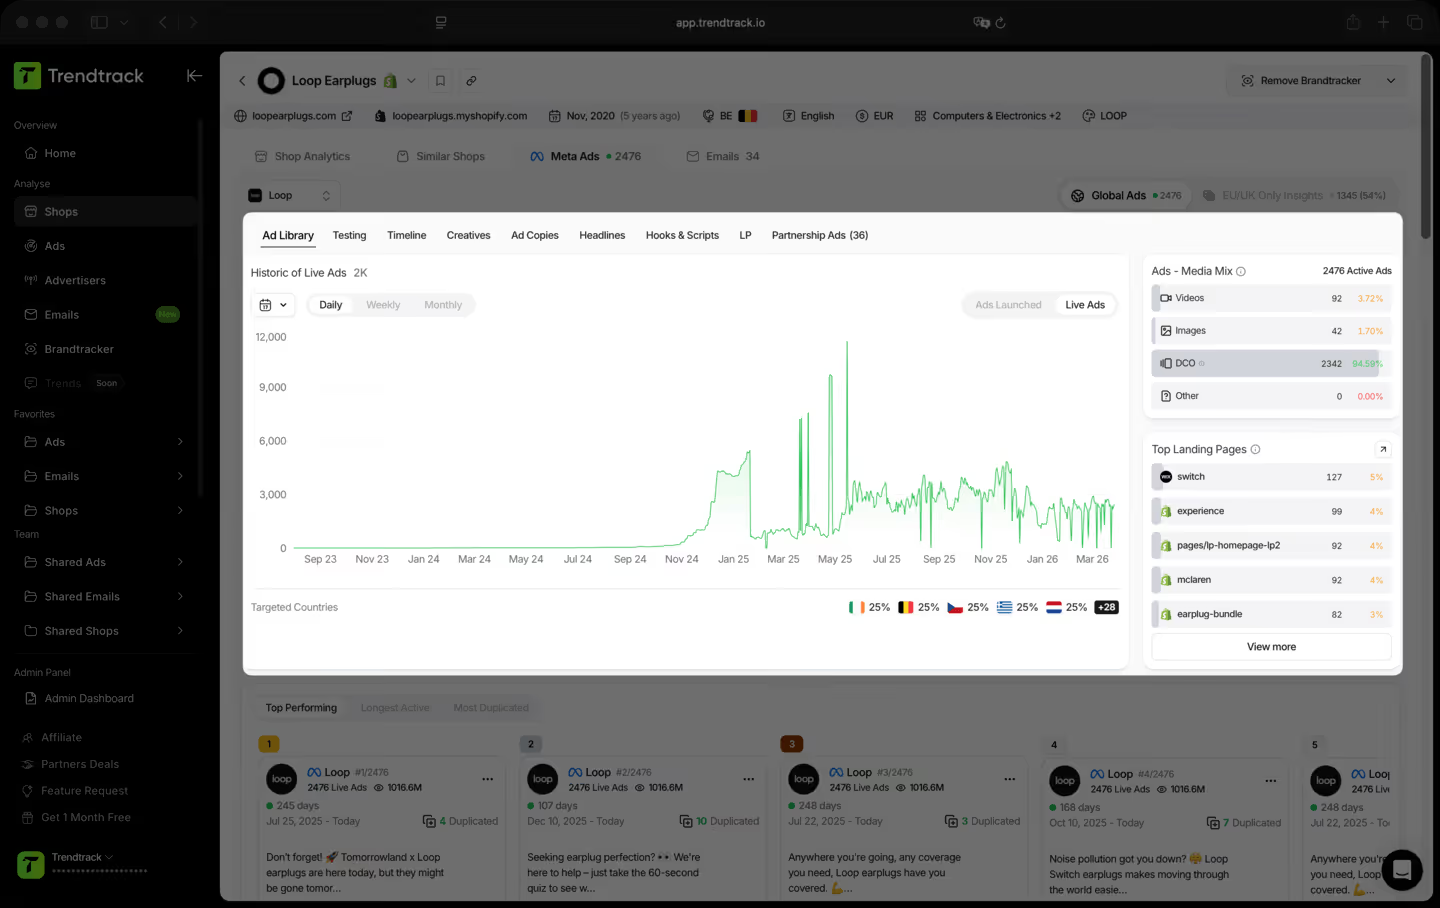
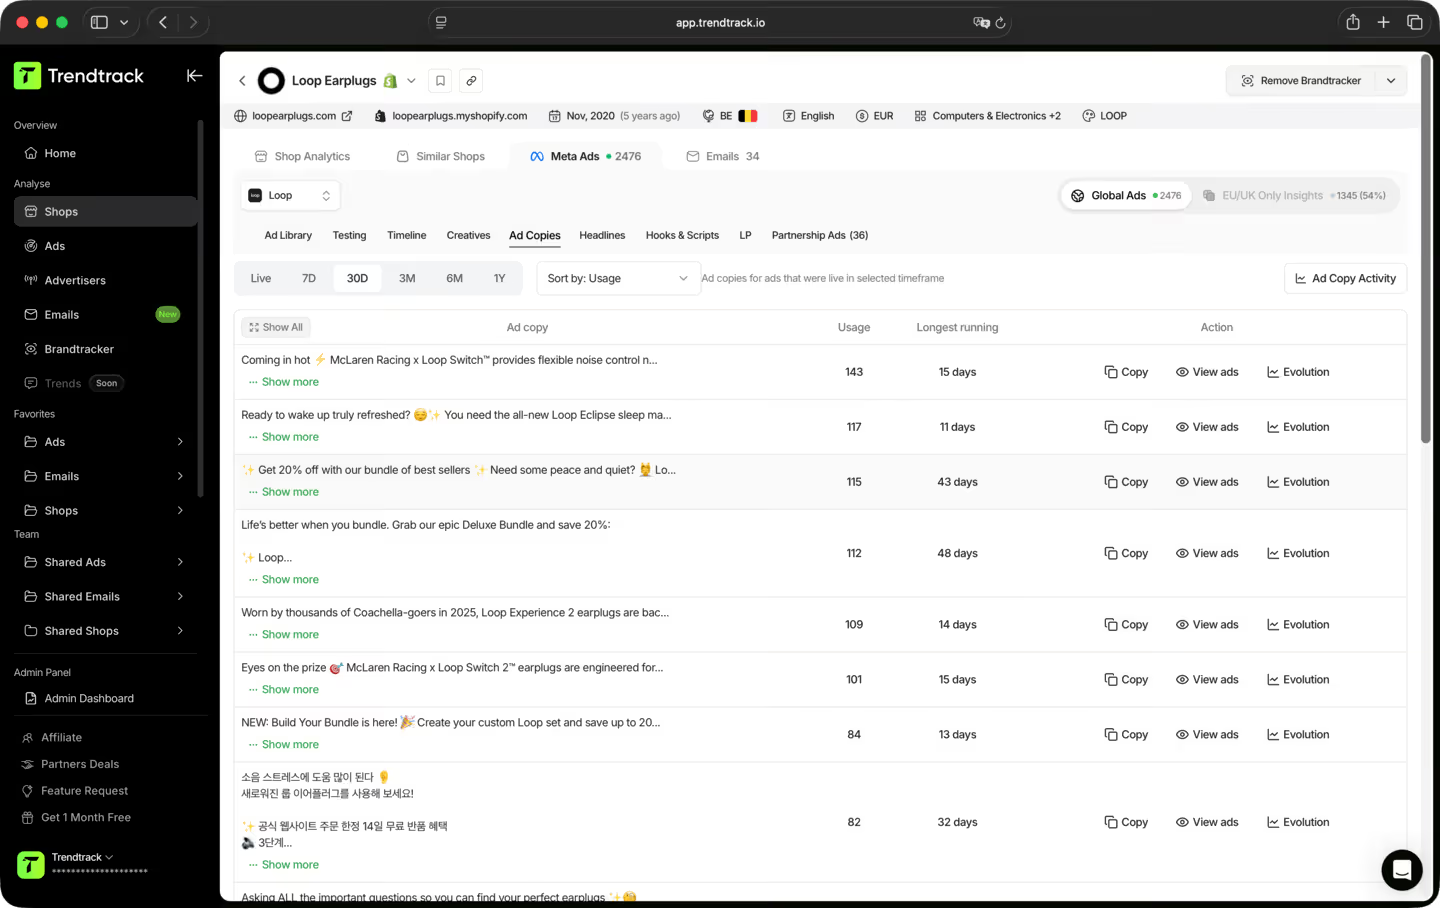
Een eenvoudige workflow om performance, patronen en top creatives uit te splitsen



Veelgestelde vragen
Kun je het antwoord op je vraag niet vinden?
Neem contact met ons op door hier te klikken.
TrendTrack is het ecommerce-intelligence-platform gebouwd rond één obsessie: je de meest accurate, meest actuele marktdata bieden die er is. Elke store, elke ad, elke mail, elk spend-signaal, elke 24 uur bijgewerkt. Want weten wat er nu succesvol is in ecom heeft alleen zin als "nu" ook echt nu betekent.
De meeste tools laten zien wat vorige maand werkte. Wij laten zien wat vandaag werkt. Onze infrastructuur scant dagelijks het volledige Shopify- en Meta-ecosysteem, met 2 tot 3 miljoen nieuwe advertenties die elke 24 uur worden geïndexeerd. Geen vertragingen, geen redactionele filters, geen subjectieve keuzes. Gewoon de markt, live.
Voor iedereen die e-commercebeslissingen neemt en zich geen fouten kan veroorloven. Beginners die een product willen valideren voordat ze ook maar één euro uitgeven. Operators wiens ads uitgeput raken en dringend nieuwe invalshoeken nodig hebben. Merken en bureaus die marktverschuivingen willen zien vóórdat ze plaatsvinden. Als jouw beslissingen afhangen van weten wat er nu echt werkt, is dit jouw tool.
Het is een van de beste manieren om je eerste stappen minder riskant te maken. In plaats van te gokken, zie je precies welke producten aan populariteit winnen, welke ads aan het opschalen zijn en welke niches aan het opwarmen zijn, allemaal in real time. Je gokt niet op een gevoel. Je vertrouwt op live marktsignalen.
Ja. De snelste manier om een nieuwe invalshoek te vinden, is door te zien wat al werkt, binnen én buiten jouw niche. TrendTrack geeft je toegang tot miljoenen actieve creatives, gerangschikt op performance-signalen, dagelijks bijgewerkt. De volgende winnende hook draait ergens al. Wij helpen je hem te vinden.
Dat hangt af van je plan. Elk plan heeft zijn eigen toegangsniveaus en gebruiksmogelijkheden. Voordat je een abonnement afsluit, raden we je aan onze pricing pagina te bekijken zodat je zeker weet dat je het plan kiest dat bij je behoeften past.
Ja. Geen verplichtingen, geen lange contracten. Zeg je account op wanneer je maar wilt.
Klaar om een brand van miljoenen te bouwen?
.avif)