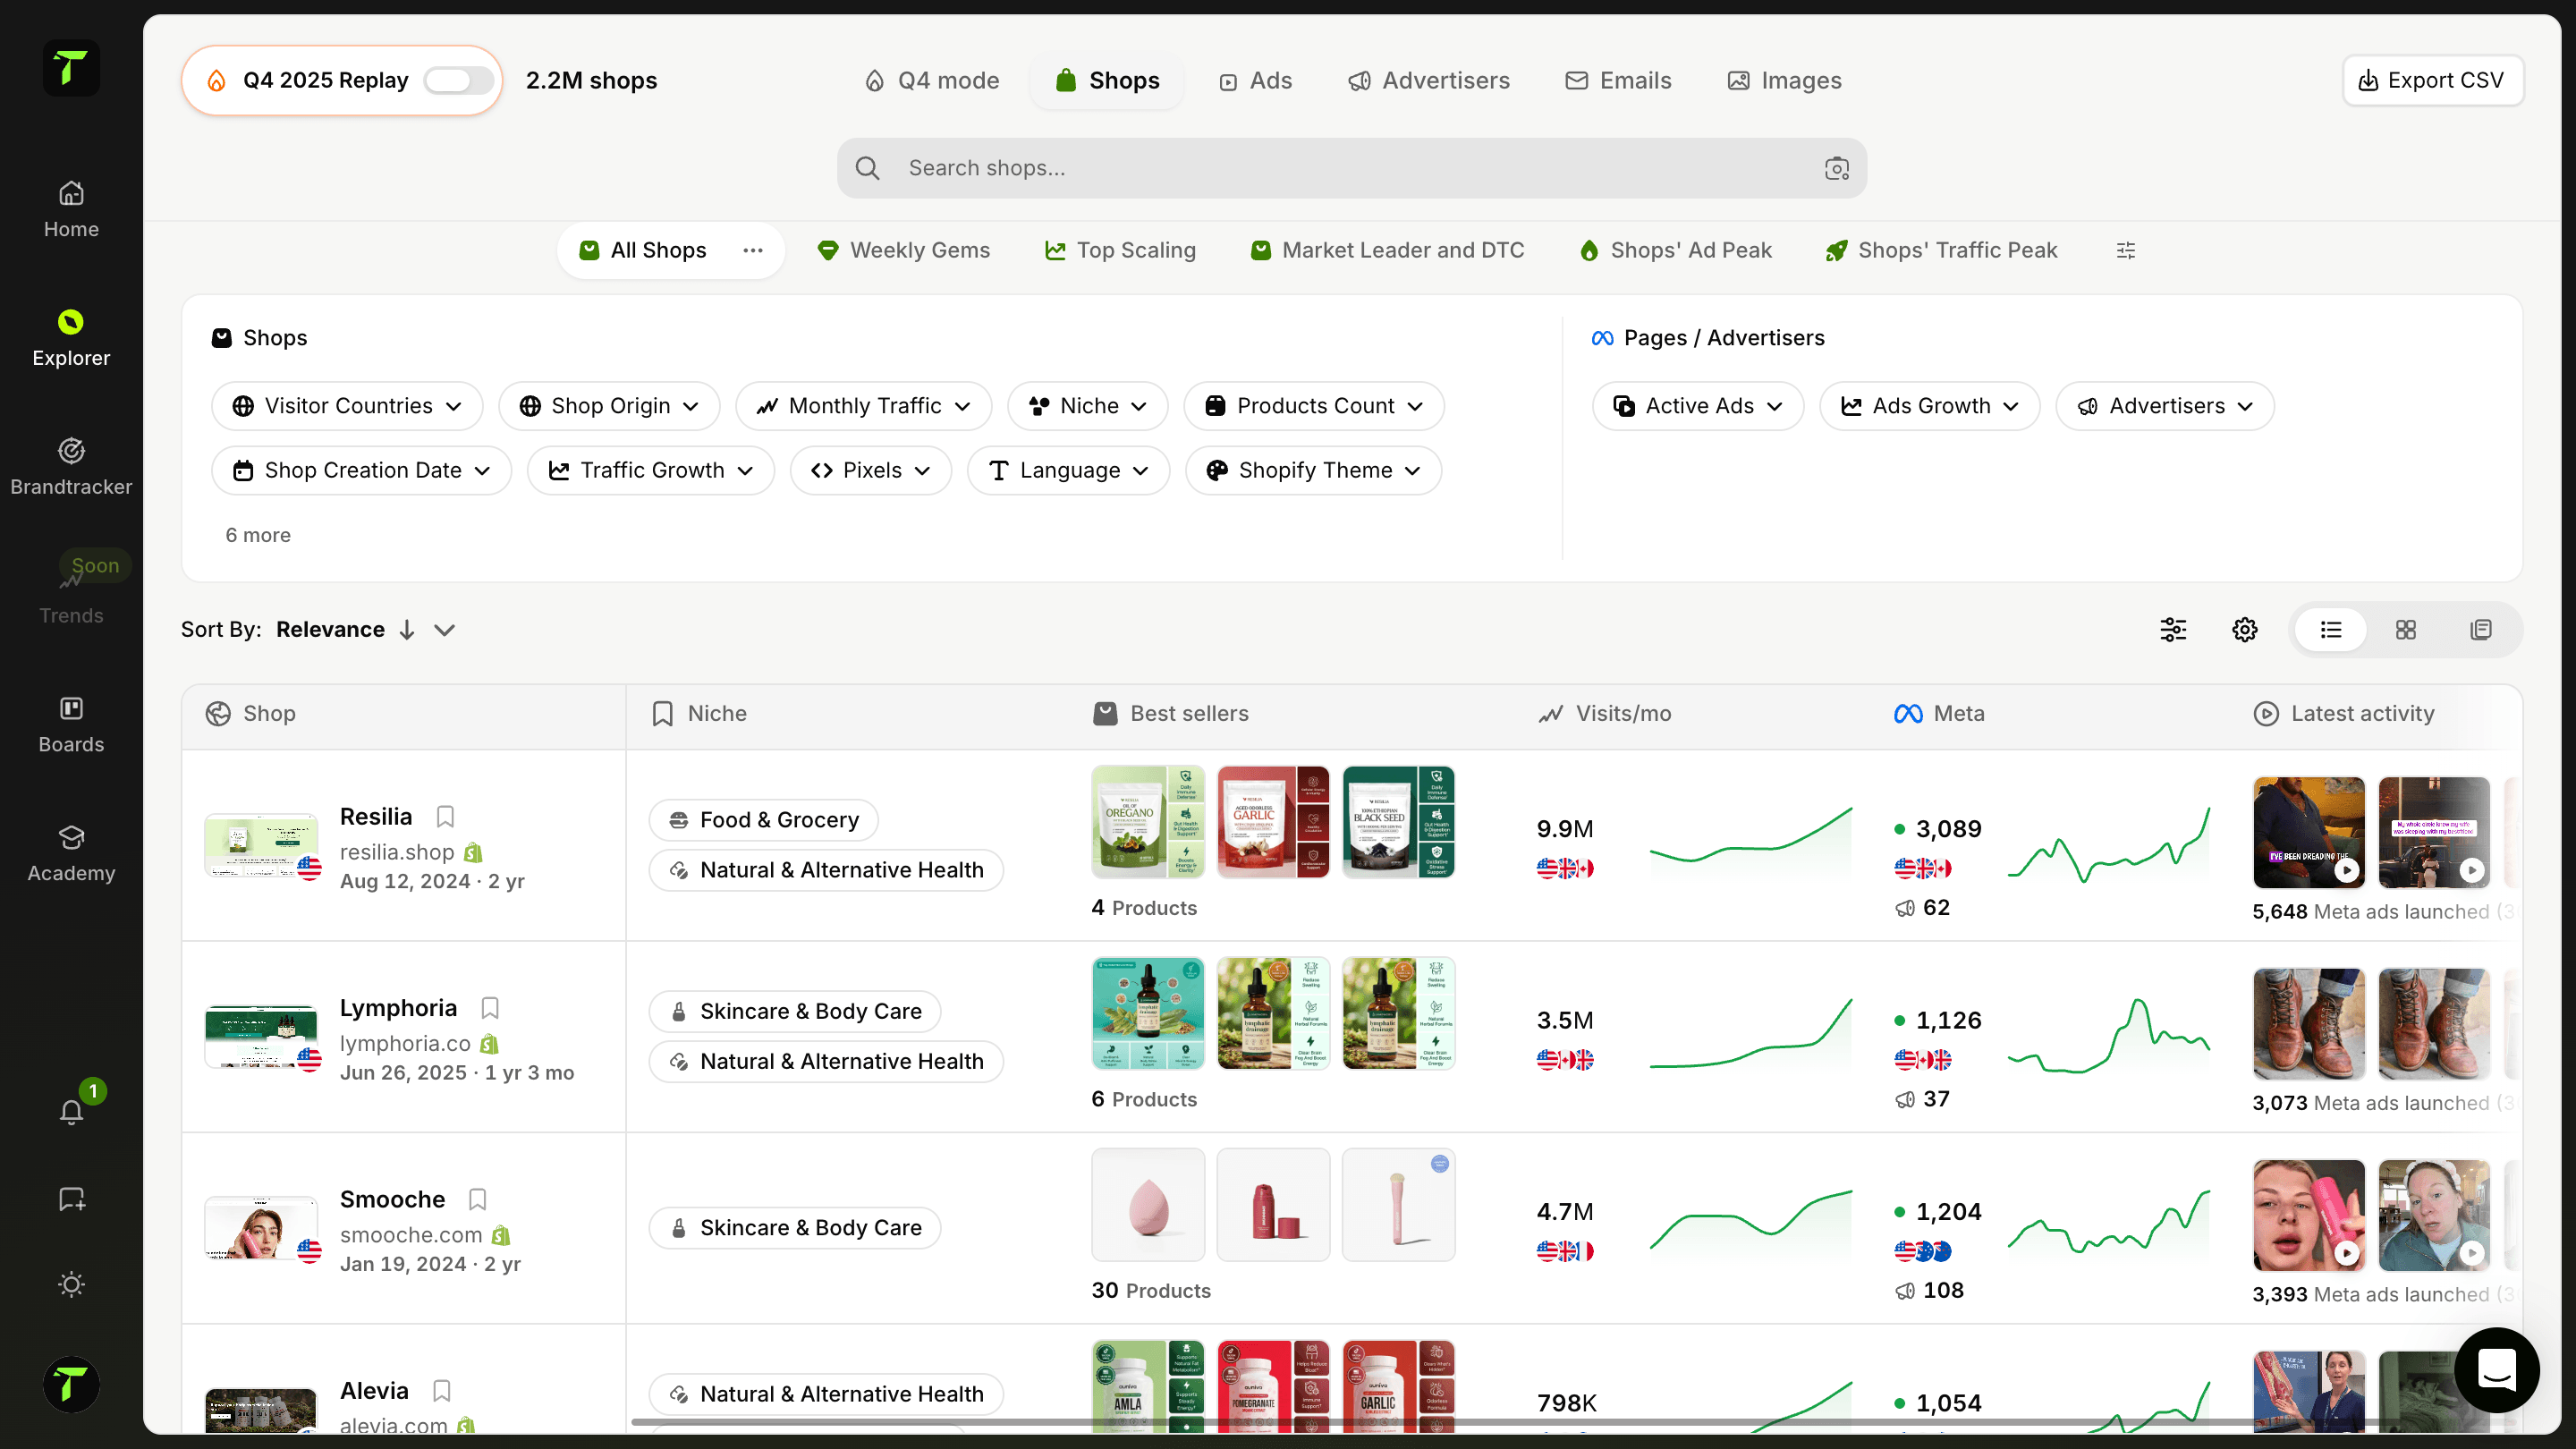
Monitora la performance degli shop e comprendi la loro strategia di crescita
Analytics approfondite per qualsiasi store Shopify. Monitora i trend di traffico, analizza la cronologia delle ads, esamina i feedback dei clienti, traccia la crescita sui social e comprendi la strategia di prodotto. Ottieni il quadro completo di come uno shop opera e scala.
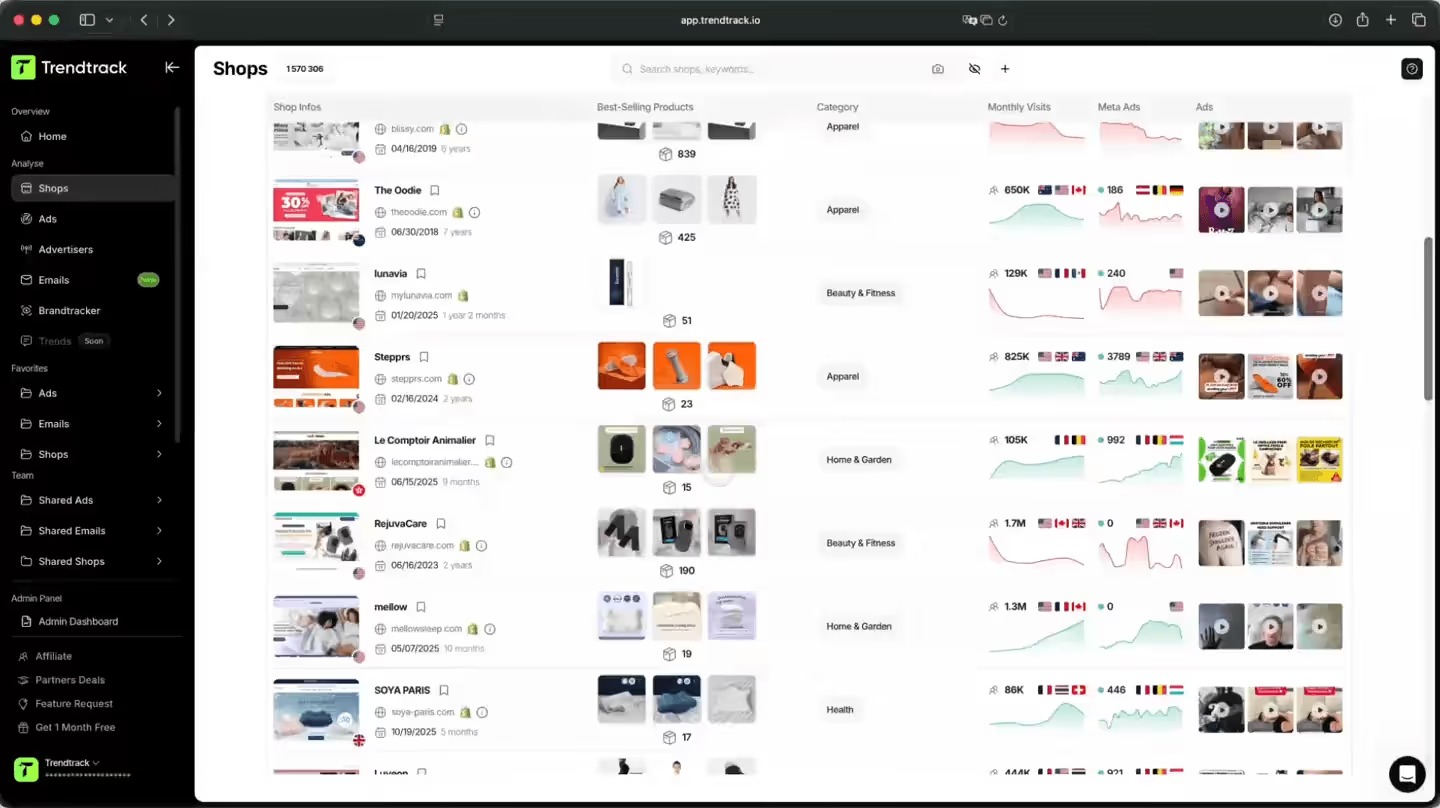
Un modo più smart per analizzare qualsiasi shop da ogni angolazione
Ottieni un’analisi completa di qualsiasi store Shopify. Monitora i trend di traffico, analizza l’intera cronologia delle ads, esamina prodotti e feedback dei clienti e traccia la crescita social su tutte le piattaforme.

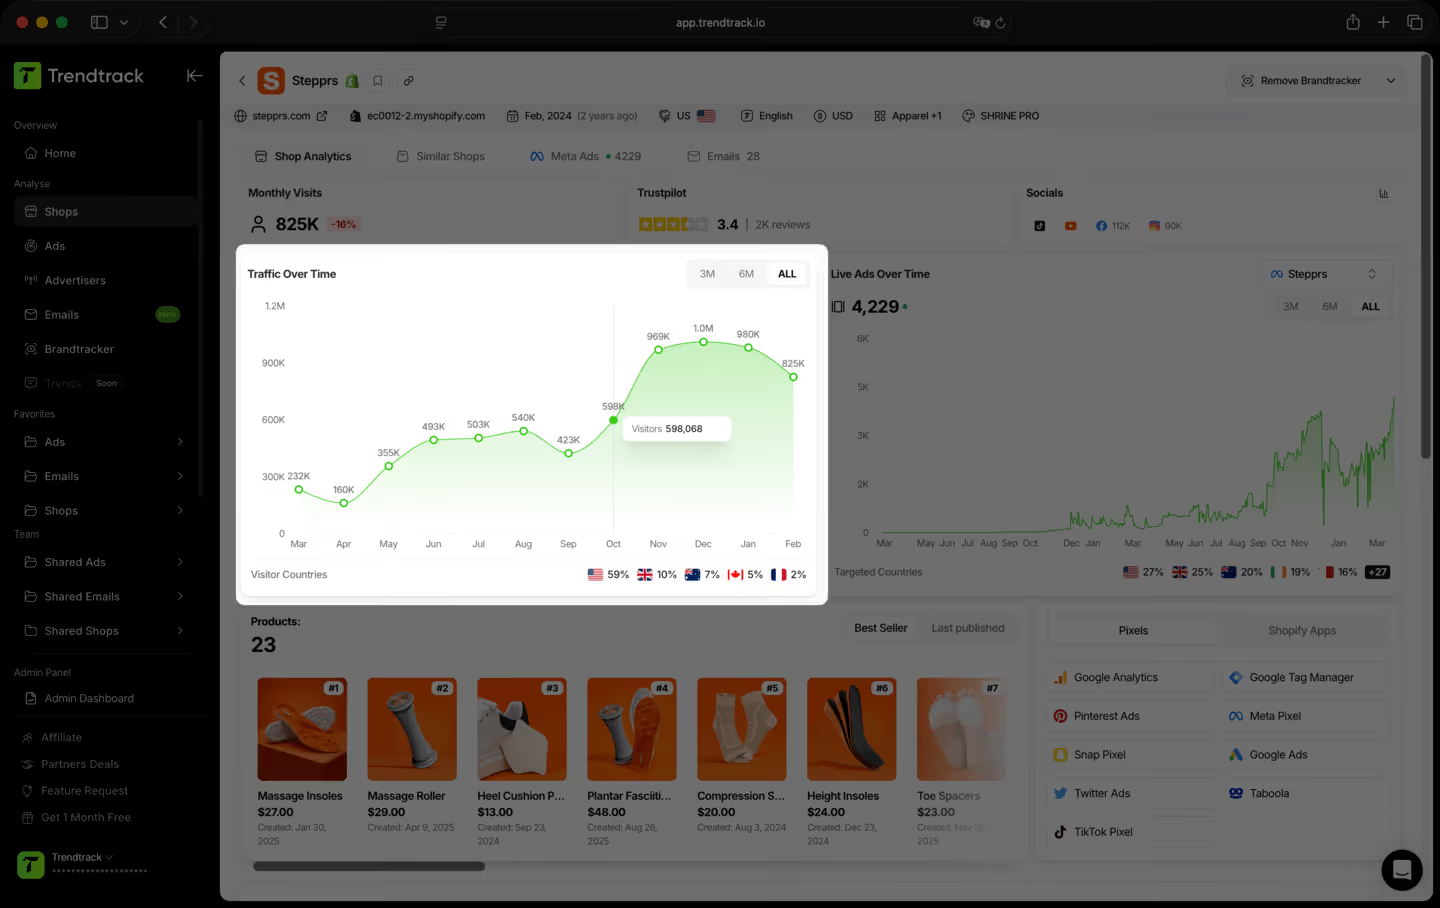
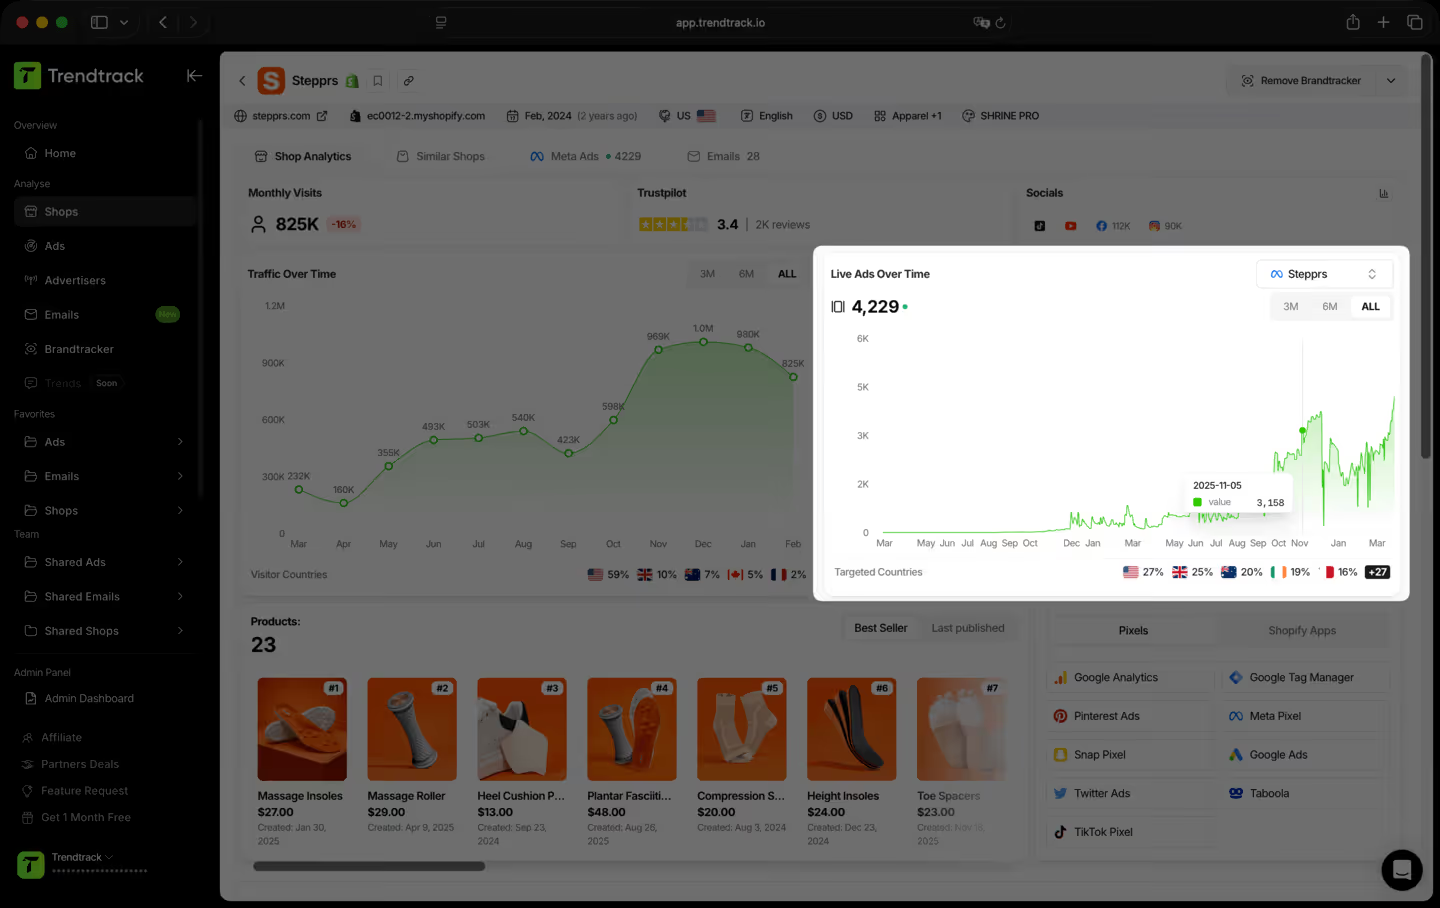
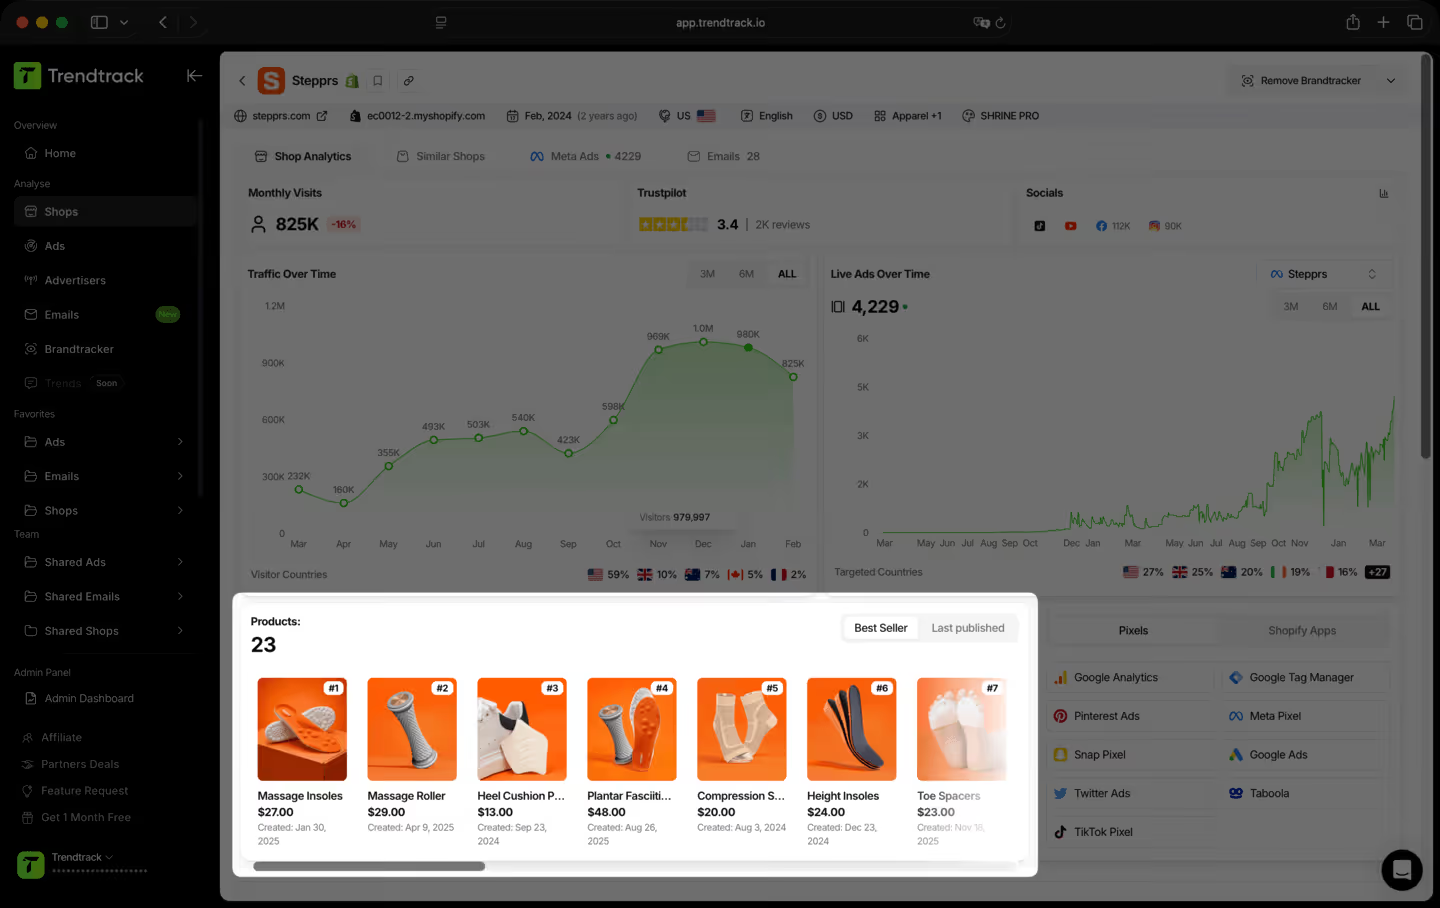
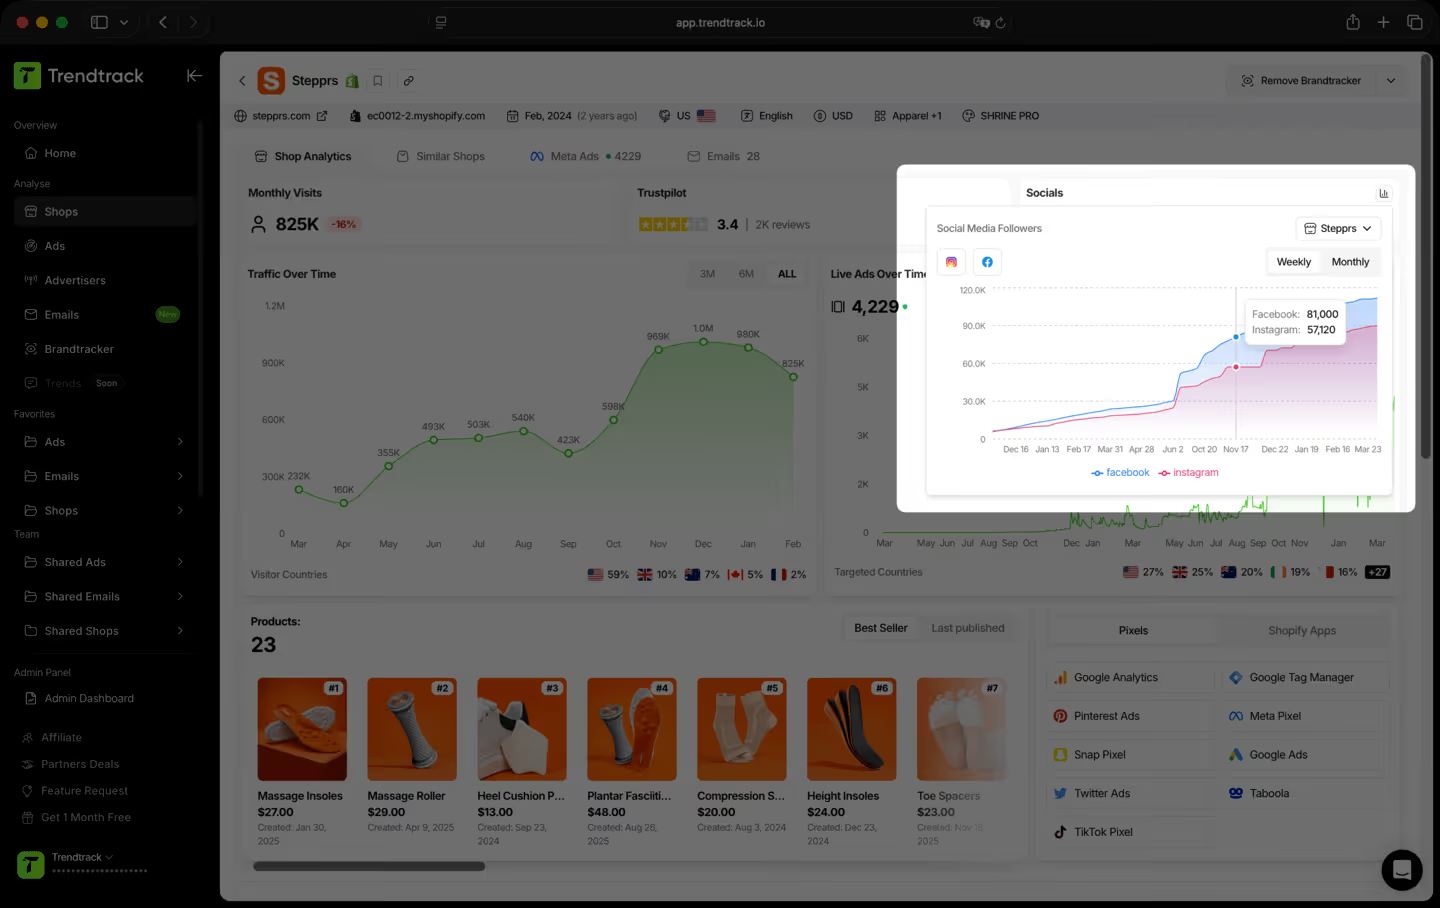
Un workflow semplice per esaminare performance, ads, prodotti e crescita



TrendTrack è la piattaforma di ecommerce intelligence costruita attorno a un'unica ossessione: darti i dati di mercato più accurati e più aggiornati disponibili. Ogni store, ogni ad, ogni mail, ogni segnale di spesa, aggiornati ogni 24 ore. Perché sapere cosa sta funzionando nell'ecom in questo momento è utile solo se "in questo momento" significa davvero adesso.
La maggior parte degli strumenti ti mostra cosa funzionava il mese scorso. Noi ti mostriamo cosa funziona oggi. La nostra infrastruttura scansiona ogni giorno l'intero ecosistema Shopify e Meta, da 2 a 3 milioni di nuovi annunci indicizzati ogni 24 ore. Nessun ritardo, nessun filtro editoriale, nessuna scelta soggettiva. Solo il mercato, in tempo reale.
Chiunque prenda decisioni nell'e-commerce e non possa permettersi di sbagliare. Principianti che vogliono validare un prodotto prima di spendere un euro. Operatori le cui ad stanno perdendo efficacia e hanno bisogno di nuovi angle. Brand e agenzie che devono vedere i cambiamenti del mercato prima che accadano. Se le tue decisioni dipendono dal sapere cosa funziona davvero in questo momento, questo è lo strumento che fa per te.
È uno dei modi migliori per ridurre i rischi delle tue prime mosse. Invece di tirare a indovinare, puoi vedere esattamente quali prodotti stanno guadagnando terreno, quali ad stanno scalando e quali nicchie si stanno scaldando, tutto in tempo reale. Non stai scommettendo su un'intuizione. Stai scommettendo su segnali di mercato reali.
Sì. Il modo più veloce per trovare un nuovo angolo è vedere cosa sta già funzionando, nella tua nicchia e non solo. TrendTrack ti dà accesso a milioni di creatività attive, classificate in base ai segnali di performance, aggiornate ogni giorno. Il prossimo hook vincente sta già girando da qualche parte. Noi ti aiutiamo a trovarlo.
Tutti i nostri dati provengono direttamente da fonti reali, nessun numero inventato, nessuna stima presa dal nulla. La spesa pubblicitaria è ottenuta direttamente dai dati di Meta. Il traffico degli store è fornito da SimilarWeb, il provider di traffic intelligence più affidabile del settore. Aggiornato ogni 24 ore, ti offre la lettura più precisa di ciò che sta scalando in questo momento, abbastanza solida da individuare i vincitori, seguire i brand emergenti e segnalare le tendenze prima che raggiungano il picco.
Dipende dal tuo piano. Ogni piano ha i propri livelli di accesso e funzionalità di utilizzo. Prima di abbonarti, ti consigliamo di controllare la nostra pagina dei prezzi per assicurarti di scegliere il piano più adatto alle tue esigenze.
Sì. Nessun vincolo, nessun impegno a lungo termine. Puoi annullare direttamente dal tuo account quando vuoi.
Pronto a costruire un brand da un milione di dollari?
.avif)